
Figure 8.
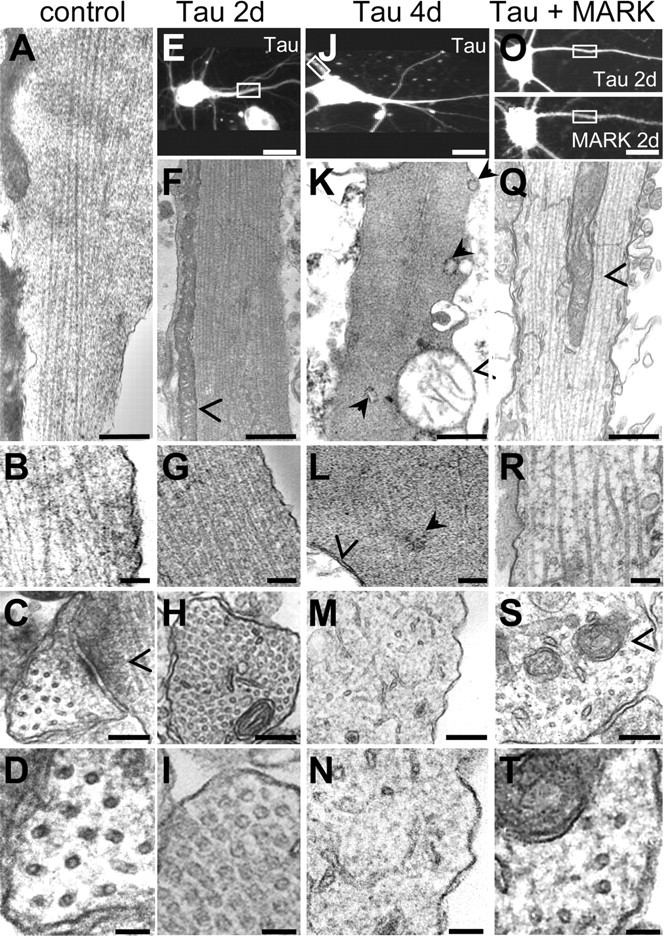
Thin sectioning electron microscopy of tau-transfected and tau plus MARK2 transfected dendrites. A–D, Electron micrographs of longitudinal and cross sections of control dendrites. A, B, Longitudinal sections of dendrites. Microtubule density is ∼120/μm2, corresponding to typical spacings of ∼90 nm center to center (leaving a space of ∼75 nm between microtubule walls). C, D, Cross sections; open arrowhead indicates shaft synapse. E–I, Transfection with tau for 2 d: microtubule density increases strongly to ∼400/μm2 (spacing center to center, ∼50 nm; separation of ∼25 nm between walls). Mitochondria are elongated and are pushed to the periphery (open arrowheads). J–N, Transfection with tau for 4 d: most microtubules have depolymerized, mitochondria have rounded up, lost their cristae, and are in the process of degeneration. K, Filled arrows point to dilated endoplasmic reticulum. L, Open arrowhead, Mitochondrial membrane; filled arrow, free ribosomes. O–T, Transfection of tau plus MARK2 for 2 d results in normal-looking dendrites with loosely spaced microtubules similar to control and healthy mitochondria in the center. Open arrowhead, Mitochondria. C–D, I–H, M–N, and S–T show corresponding cross-sections. E, J, O, P, Parent cells of longitudinally sectioned dendrites. Scale bars: A, F, K, Q, 500 nm; B, G, L, R, 200 nm; C, H, M, S, 100 nm; D, I, N, T, 50 nm; E, J, O, P, 10 μm.