
Figure 3.
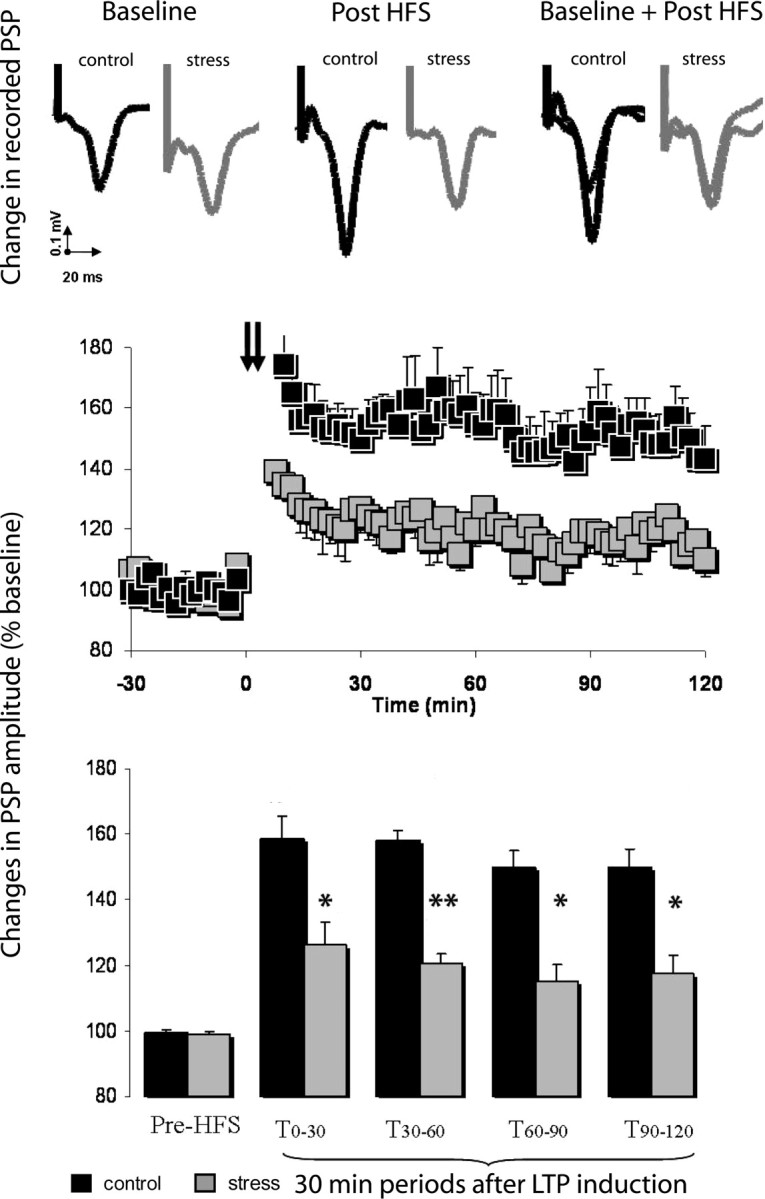
Effects of chronic stress on hippocampal-prefrontal cortex LTP. Top, Representative PSP recorded from the prefrontal cortex of chronic-stressed (n = 5) and control (n = 5) animals before and after hippocampal HFS. Middle, Chronically stressed rats displayed a deficit in HFS-induced LTP when compared with controls. Squares are mean ± SEM of the normalized PSP amplitude for 2 min periods. Hippocampal HFS is indicated by arrows. Bottom, LTP in chronically stressed rats and controls represented at different time periods. The first and following pairs of columns represent mean ± SEM of the average normalized PSP amplitude in consecutive 30 min periods before and after HFS, respectively. *p < 0.05 and **p < 0.01 compared with controls. Error bars represent SEM.