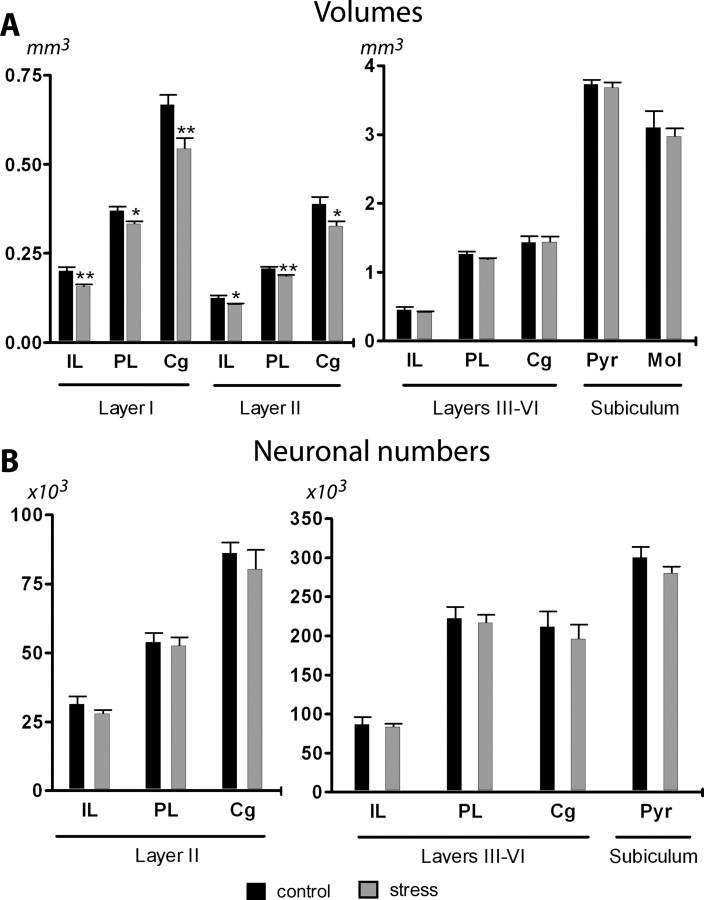
Figure 4.
Effects of chronic stress on the volumes and number of neurons of the different mPFC areas and subiculum. A, Average volumes of layers I, II, and III–VI of the IL, PL, and Cg regions of the mPFC and the molecular (Mol) and pyramidal (Pyr) layers of the subiculum. B, Estimated number of neurons in layers II and III–VI of the IL, PL, and Cg regions and the Pyr layer of the subiculum. Note the different scales used and that with the exception of the numerical values for layers I and II, which should be read off against the left axis, all other values should be read off against the right one. Control animals, n = 5; stress rats, n = 5. *p < 0.05 and **p < 0.01 compared with CON. Error bars represent SEM.

