
Figure 2.
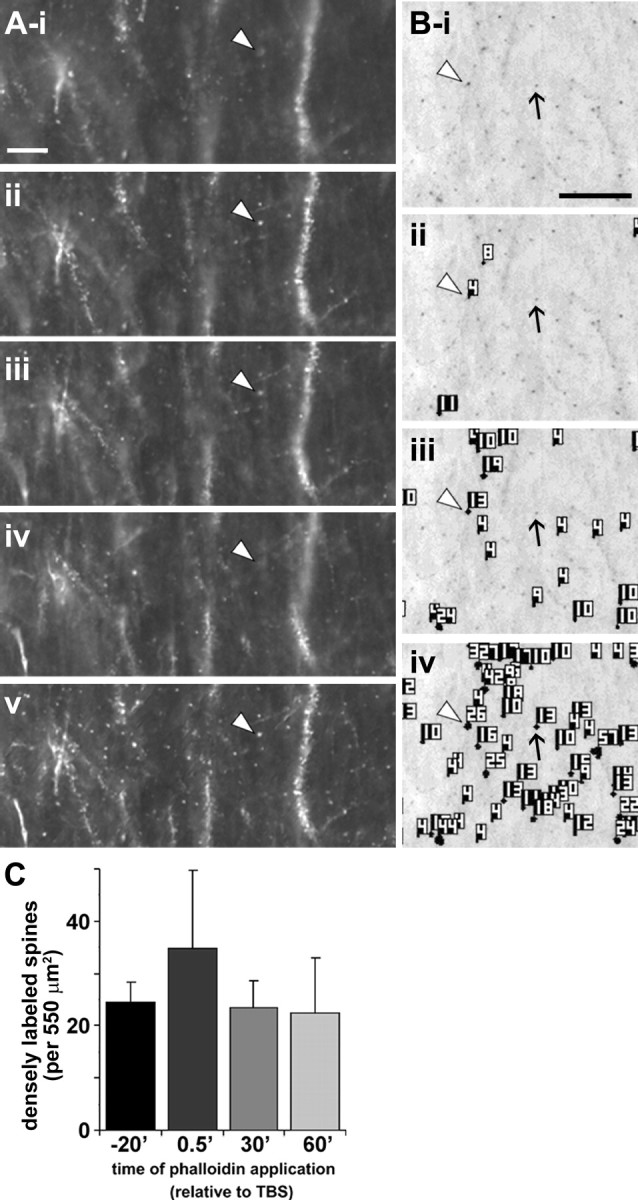
Spine detection analysis procedure for in situ rhodamine–phalloidin labeling. Panels illustrate the spine detection analytical technique for a representative phalloidin-labeled field. After experimental treatment (rhodamine–phalloidin infusion, stimulation), slices were fixed and sectioned at 20 μm to assess dendritic spine labeling. A, For each section analyzed, a series of wide-field photomicrographs were collected at regular, sequential z-axis planes (i–iv) and collapsed using extended focal imaging (v) to eliminate out-of-focus noise and permit accurate spine quantification through the z-axis of the slice. Scale bar: (in i) i–v, 10 μm. B, Representative photomicrograph (i) shows collapsed Z-series images from a slice given only low-frequency stimulation. For spine analysis, image pixel intensity was inverted so that rhodamine-labeled elements appear as dark puncta. ii–iv show spine detection software output for three pixel intensity threshold levels (with decreasing thresholds from ii–iv): the analysis software identified greater numbers of spines as intensity threshold was lowered. Note that intensely labeled spines (e.g., spine at arrowhead in Bi) are detected, and identified with an object number, at all threshold levels, whereas faintly labeled spines (arrow) are only detected when the intensity filter is set very low (iv). Scale bar: (in i), i–iv, 10 μm. C, Bar graph shows group mean ± SEM counts of intensely labeled spine-like puncta within the 550 μm2 sample region for hippocampal slices infused for 20 min with rhodamine–phalloidin beginning 20 min before TBS (−20′) or 0.5, 20, or 60 min after TBS (spines detected at high threshold, 145 PIU levels only). There were no significant differences in labeled spine counts between groups (p > 0.7, one-way ANOVA).