
Figure 3.
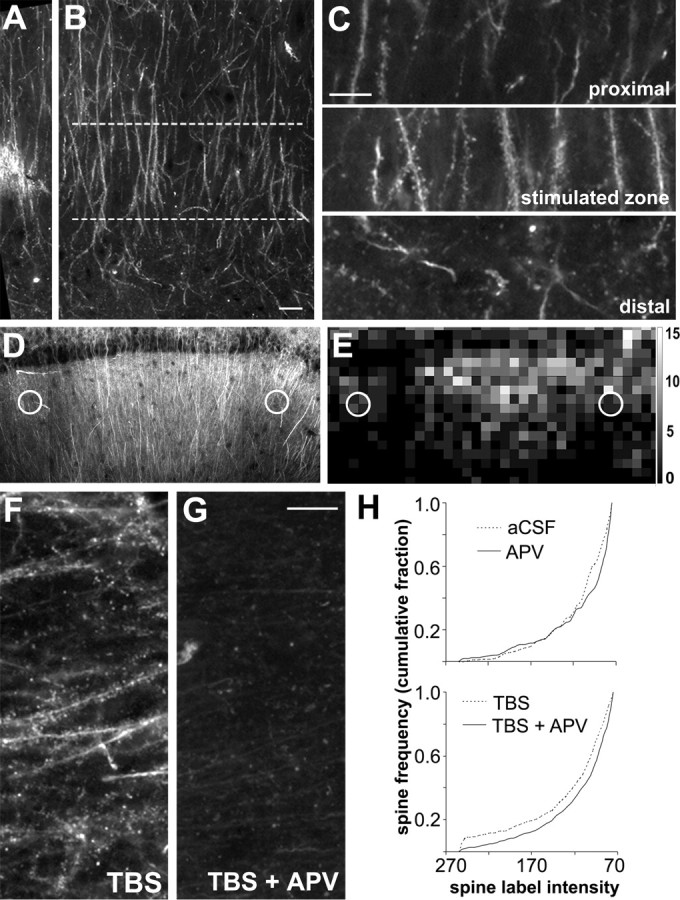
TBS-induced F-actin labeling is spatially restricted and blocked by an NMDA receptor antagonist. A, B, Low-power photomicrographs of CA1 str. radiatum in an adult hippocampal slice labeled with rhodamine–phalloidin in situ. Bright labeling in the middle of A marks the location of the stimulation electrode (40–60 μm below surface of slice) in the mid-distal portion of str. radiatum. The lamina aligned with the proximodistal position of the stimulation electrodes is outlined (between dashed lines) in B. Scale bar: (in B) A, B, 10 μm. C, Enlargements of the stimulated zone (middle) and adjacent proximal (top) and distal (bottom) regions from B show that robust spine labeling is restricted to lamina containing the stimulated afferents. Scale bar, 10 μm. D, Photomicrograph of hippocampal field CA1 from a slice that received TBS; stimulation electrode placements are indicated by white circles. E, Spatial frequency map plots the distribution of intensely labeled spine numbers (>145 PIU) across 10 × 10 μm sampling zones for the hippocampal field shown in D. Intensely labeled spine frequencies are represented by grayscale intensity. Grayscale calibration bar (at right) shows number of spines per sampling region represented by the different gray levels. F, G, Photomicrographs of sample regions taken from phalloidin-labeled slices receiving TBS in the presence of aCSF alone (TBS) or together with 100 μm APV (TBS + APV). Scale bar, 10 μm. H, Top graph describes cumulative fraction of spine counts across the full range of label pixel intensities within the 550 μm2 sampling zone for control unstimulated slices (aCSF, dashed line) versus slices treated with APV (solid line). Bottom graph plots same distribution for slices stimulated with TBS in aCSF (dashed line) compared with slices receiving TBS in the presence of APV (solid line).