
Figure 4.
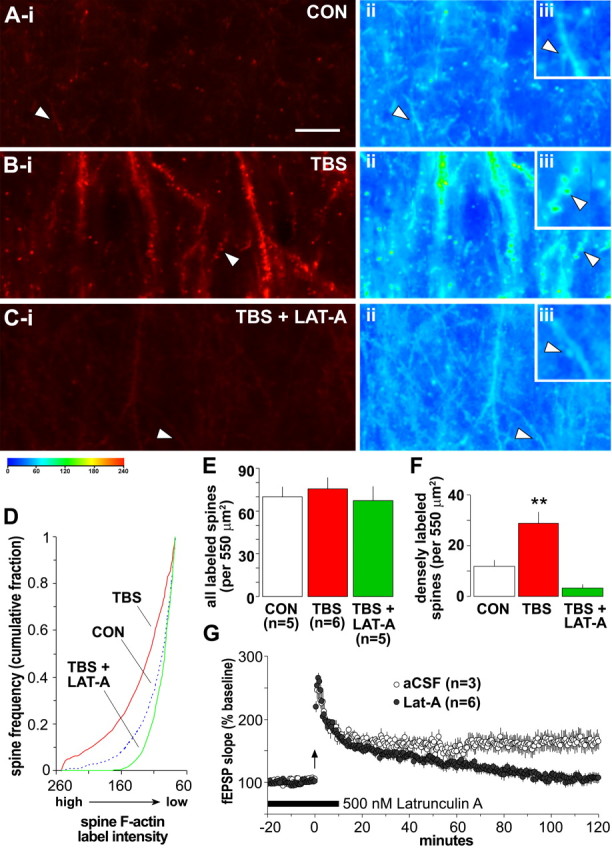
TBS-induced increases in the number of densely labeled spines are reversed by latrunculin A. A–C, Left, Photomicrographs of 550 μm2 sample regions taken with low-intensity illumination, from in situ phalloidin-labeled slices that received either baseline stimulation (CON), TBS, or TBS in the presence of 500 nm latrunculin A (LAT-A). Note that TBS caused a marked increase in structures containing dense phalloidin labeling of F-actin and that this effect was eliminated by latrunculin A. Pseudocolor representations of label density (PIU calibration at bottom) for these three sections are shown to the right (ii and iii in A–C). The control (Aii) has numerous lightly labeled (blue end of spectrum) puncta that, at higher magnification (inset, Aiii), can be seen to be spines. The TBS slice with potentiated synapses (Bii, Biii) has numerous green to yellow puncta, indicative of dense labeling; these profiles are absent in the latrunculin A-treated slice (Cii, Ciii) that also received TBS. Scale bar: (in A) Ai–Ci, Aii–Cii, 10 μm; Aiii–Ciii, 5 μm. D, Plot describes spine frequency (expressed as a cumulative fraction of the total number of labeled spines) as a function of mean spine label intensity for groups of slices receiving baseline/control stimulation (CON, blue dashed line), TBS (red solid line), or TBS in the presence of 500 nm latrunculin A (green solid line). The intensity distribution for TBS-treated slices is significantly shifted toward high-intensity labeling compared with controls (K–S test, D = 0.25; p < 0.0001), whereas latrunculin A-treated slices exhibited almost no intensely labeled spines (K–S test vs controls, D = 0.10; p < 0.01). E, Bar graph plots group mean ± SEM values for the total number of identifiable spines (with label intensity of ≥75 PIU) from the independent experiments contributing to data plotted in D: the total number of labeled spines did not differ across treatment groups (p > 0.7, one-way ANOVA). F, Graph shows group mean ± SEM values for numbers of intensely labeled spines (label intensity of ≥145 PIU) from independent experiments contributing to data plotted in D: values demonstrate that infusion of latrunculin A before TBS eliminated the presence of intensely labeled spines normally produced by TBS (**p < 0.01, two-tailed t test vs control group). G, Graph shows fEPSP slopes recorded from control slices (aCSF, open circles) or those receiving bath application of 500 nm latrunculin A (filled circles) for 30 min beginning 20 min before TBS (arrow). In latrunculin A-treated slices, LTP was significantly attenuated by 2 h after TBS compared with aCSF controls (p < 0.01, two-way repeated-measures ANOVA for minutes 100–120).