
Figure 8.
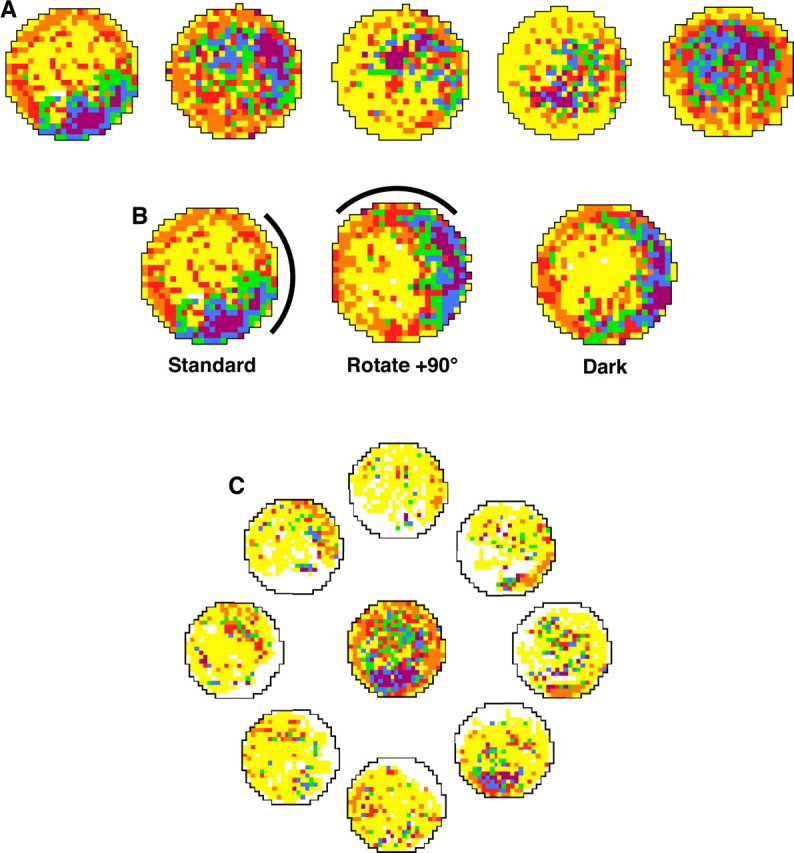
Place cells in a DTN-lesioned rat. A, Firing rate-by-place functions plotted for five hippocampal cells recorded in a DTN-lesioned rat (Table 1, rat 149). B, A place cell recorded when the white cue card was rotated +90°. As in intact animals, the place field followed the cue. C, Central plot shows firing rate by place for all head directions, as with a standard place cell analysis. The outer eight place–rate maps represent place-modulated activity when the rat's head is pointing in the direction indicated by the plot. For all plots, white pixels indicate that the animal did not visit the location, yellow pixels represent locations visited by the rat but at which the cell did not fire, and other pixels are assigned colors in ascending order according to their firing rate (orange, red, green, blue, and purple), with orange representing the lowest firing rates and purple the highest firing rates. See Materials and Methods for details.