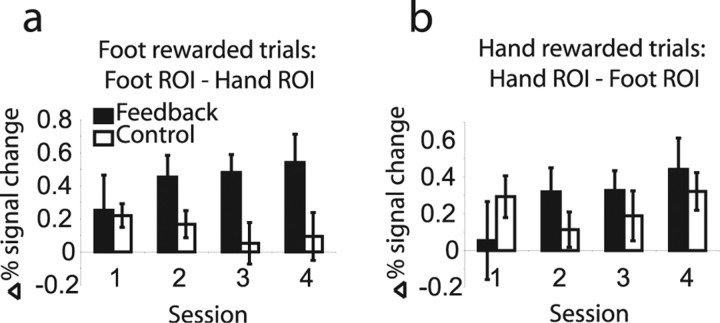
Figure 5.
Percentage signal change plots across sessions for feedback and control groups from experiment 2. a, Difference in percentage signal change between foot and hand ROIs when foot responses were rewarded. b, Difference in percentage change between hand and foot ROIs when hand responses were rewarded. Error bars indicate SE.

