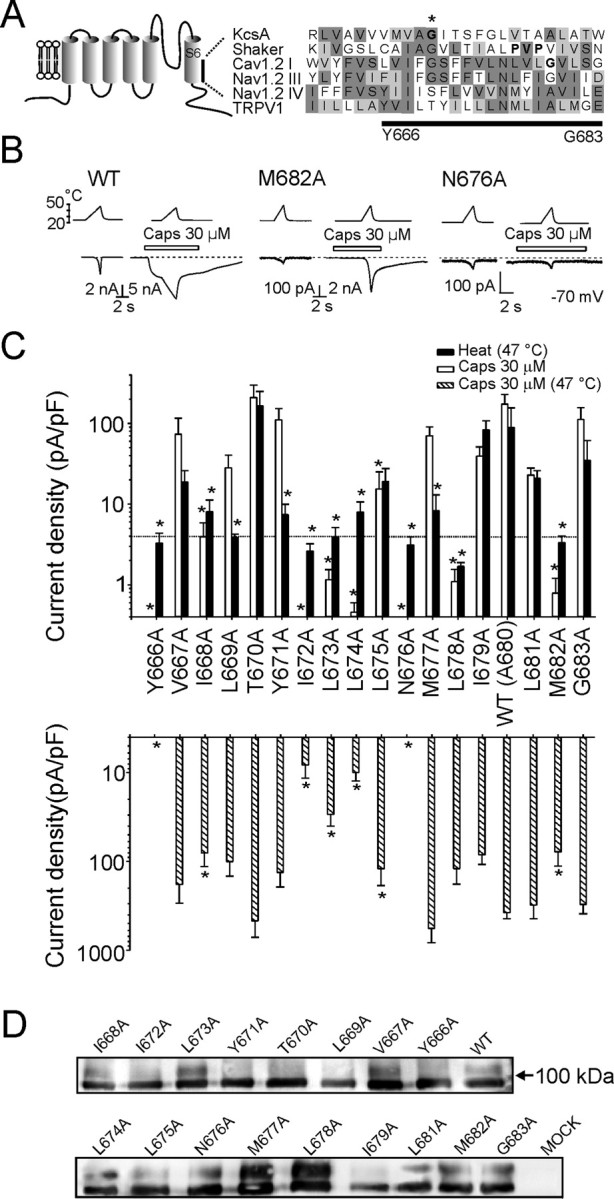
Figure 1.

Alanine-scanning mutagenesis of the inner-pore region (Y666-G683) of the TRPV1 channel. A, Putative secondary structure of the TRPV1 channel subunit. Comparison of the inner-pore region of rat TRPV1 (GenBank accession number AAC53398) with that of KcsA (P0A334), Shaker (CAA29917), Cav 1.2 I (P15381), and Nav 1.2 III and IV (NP_036779) proteins is shown. Protein sequences were aligned using MUSCLE multiple alignment software (http://phylogenomics.berkeley.edu/cgi-bin/muscle/input_muscle.py) with Blosum62 score colors. In KcsA and Shaker, sequences were manually adjusted to specifically align conserved mid-glycine residues. Conserved amino acid residues proposed to serve as gating hinges in some of the channels are indicated with an asterisk and with bold type. B, Representative whole-cell currents evoked by heat stimuli with or without 30 μm capsaicin at −70 mV in wild-type TRPV1 and in M682A and N676A mutants. Bath temperature is plotted above. Open bars indicate duration of drug application. Dashed lines indicate zero current level. C, Summary of alanine-scanning mutagenesis results. Bar graphs show average whole-cell current densities evoked at 25°C by 30 μm capsaicin and by heat (47°C) (top graph) and whole-cell current densities induced by 30 μm capsaicin at 47°C for each mutant (bottom graph). The dotted line indicates 4 pA/pF, which roughly corresponds to the estimated amplitude of thermally induced nonspecific currents at 47°C. Each bar is the mean ± SEM of at least four independent cells. Statistical significance is indicated (*p < 0.05). D, Western blot of surface-expressed wild-type and alanine mutants of TRPV1 using an anti N-terminal TRPV1 antibody after surface biotinylation of cells transfected with each receptor or mock transfection control (see Materials and Methods for details).
