Figure 3.
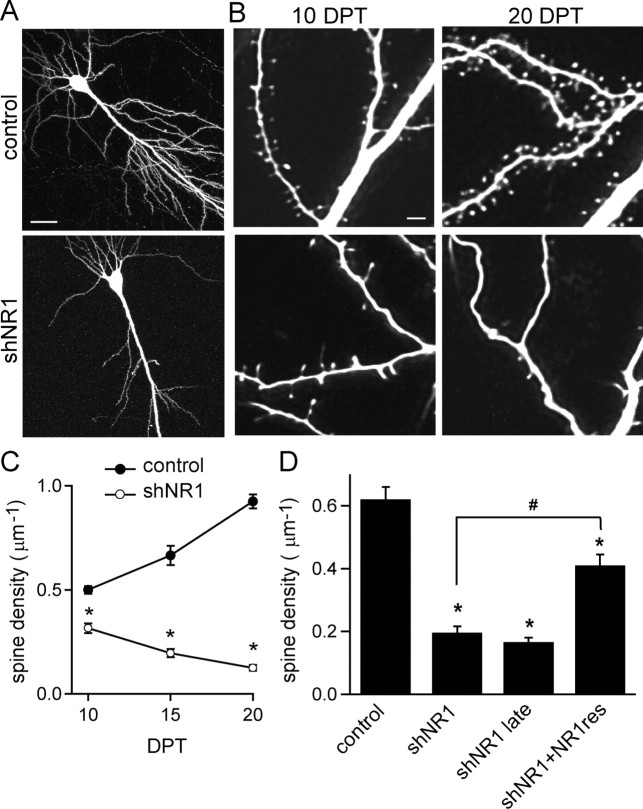
Loss of dendritic spines in neurons with reduced synaptic NMDARs. A, Hippocampal pyramidal neurons in organotypic slices transfected with GFP (top) or shNR1 (bottom) imaged with a 2PLSM at 20 DPT. B, Higher-magnification images of dendrites from control (top) and shNR1 (bottom) neurons at 10 DPT (left) and 20 DPT (right). C, Developmental profile of spine density in control and shNR1 neurons (n = 10–28). D, Summary of spine density at 15 DPT in a variety of conditions. NR1res denotes the NR1-1-resistant clone with silent mutations in the region targeted by shNR1; shNR1 late summarizes data from neurons transfected with shNR1 at 8 DIV (instead of 3 DIV) and imaged at 10 DPT. Scale bars: A, 50 μm; B, 2 μm. *p < 0.05 compared with control; #p < 0.05 compared with shNR1 neurons; by ANOVA and Student–Newman–Keuls multiple comparisons test.

