
Figure 3.
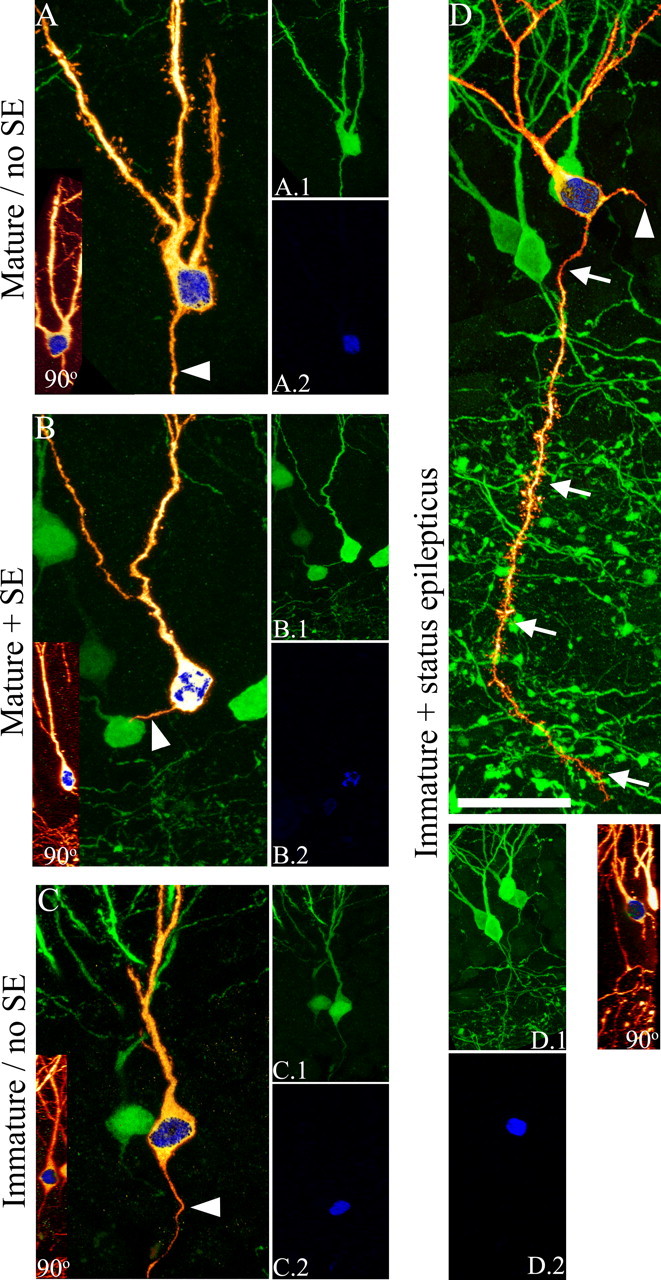
A, C, Age-matched granule cells from control animals do not have basal dendrites. B, D, Immature (D), but not mature (B), granule cells exposed to SE exhibit basal dendrites 1 month later. A–D, Digital reconstructions of BrdU-labeled, GFP-expressing granule cells (orange) superimposed on maximum projections showing BrdU-negative, GFP-expressing neighbor cells (green). BrdU labeling is shown in blue. A.1, B.1, C.1, D.1, Confocal maximum projections from confocal z-series stacks used to generate the reconstructions shown in A–D. A.2, B.2, C.2, D.2, Confocal maximum projections showing BrdU labeling. Insets, Merged 90° rotations of GFP (orange) and BrdU (blue) confocal stacks showing colocalization for each neuron. Arrowheads denote axons. Arrows denote basal dendrites. Scale bar: A–D, 20 μm; A.1–D.2, insets, 40 μm.