
Figure 3.
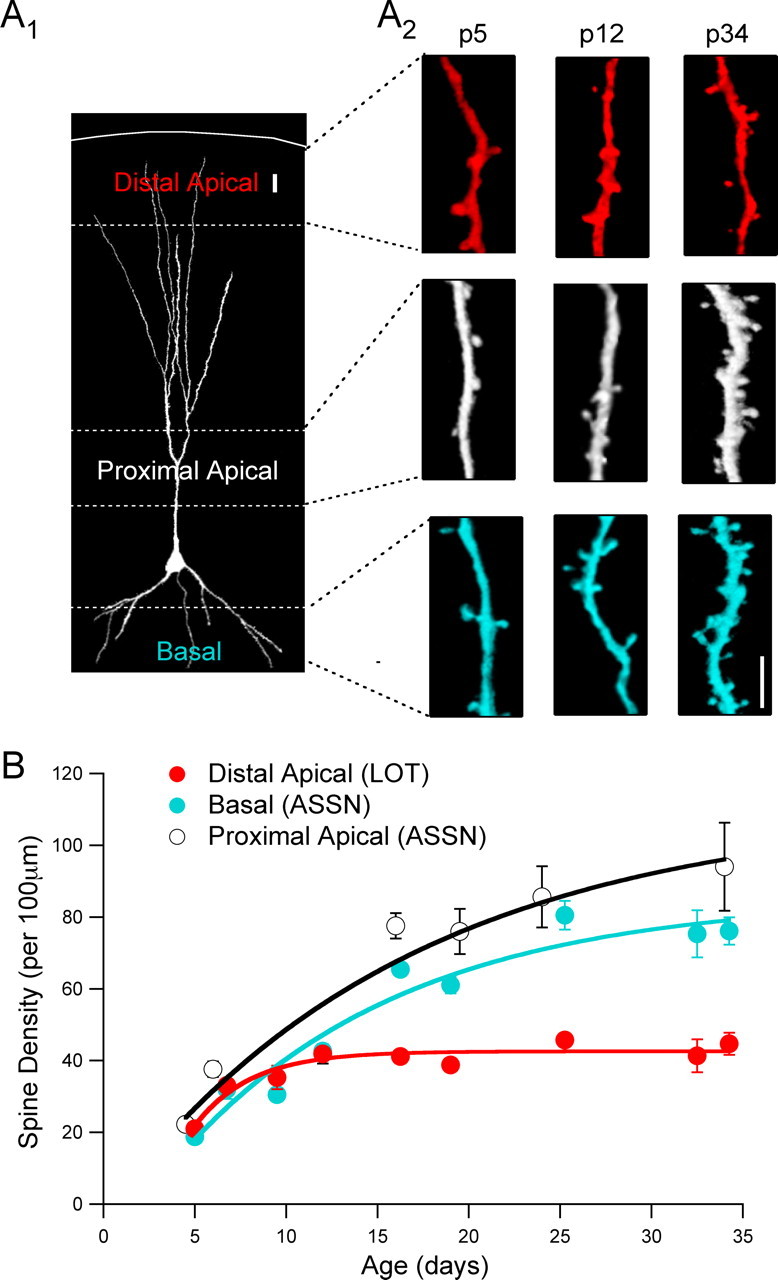
Developmental maturation of spine density occurs rapidly at dendrites receiving LOT input. A1, Two-photon image of a representative pyramidal cell (P34). Dashed lines indicate boundaries from which distal apical, proximal apical, and basal dendritic spines were measured. The solid line represents pial surface. Scale bar, 20 μm. A2, Distal apical (red), proximal apical (white), and basal dendritic (blue) regions from three cells at age P5, P12, and P34. Scale bar, 5 μm. B, Developmental time course for increases in spine density at distal apical, proximal apical, and basal dendritic compartments. Each symbol represents values averages pooled over 2 d intervals. Distal apical spine density data for the nine age groups starting from P5–P6 to P34–P35 are as follows: 21 ± 0.9, 33 ± 1.5, 35 ± 3.3, 42 ± 1.6, 41 ± 0.8, 38 ± 1.0, 46 ± 1.5, 41 ± 4.6, and 45 ± 3.1 spines/100 μm; n = ∼12 cells for each age. Basal spine density data for the nine age groups starting from P5–P6 to P34–P35 are as follows: 19 ± 1.3, 32 ± 2.7, 31 ± 1.7, 43 ± 1.7, 65 ± 1.8, 61 ± 2.3, 80 ± 4.0, 75 ± 6.6, and 76 ± 3.8 spines/100 μm; n = ∼12 cells for each age. Proximal apical spine density data for the seven age groups starting from P5–P6 to P34–P35 are as follows: 22 ± 1.9, 38 ± 2.2, 41 ± 2.7, 77 ± 3.5, 76 ± 6.3, 86 ± 8.6, and 94 ± 12.3 spines/100 μm; n = ∼5 cells for each time point. Lines are exponential fits with time constants of 3, 12, and 16 d for distal apical, basal, and proximal apical dendrites, respectively.