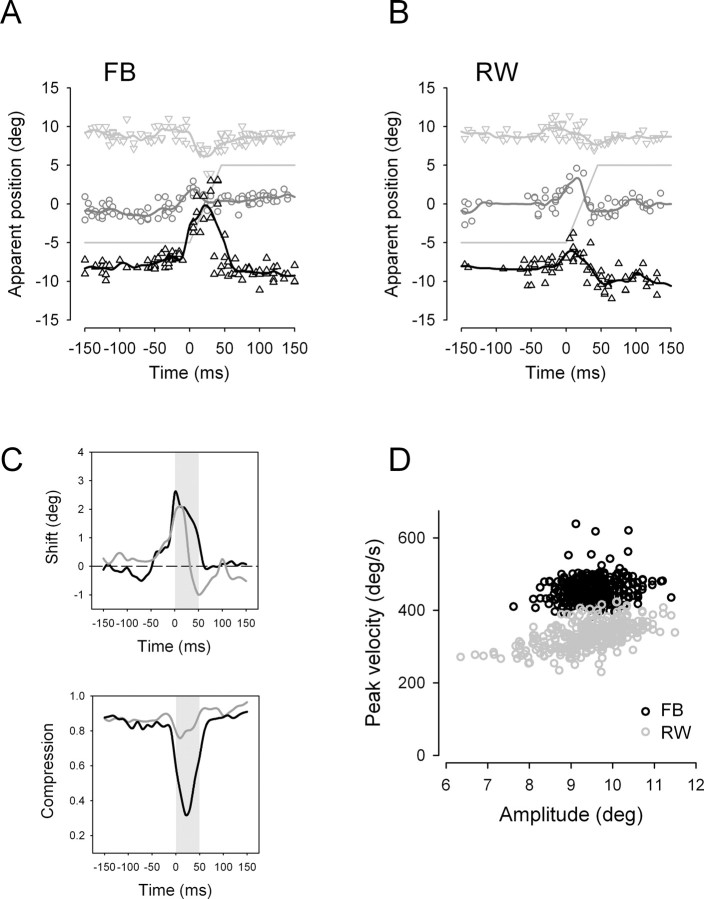
Figure 2.
A, B, Representative responses of a subject with strong (FB) and a subject with weak (RW) compression of apparent positions around saccade onset. Apparent positions of the flashed bar are aligned on saccade onset. The gray line indicates eye position. Symbols represent responses for real bar positions of −10° (black triangles), 0° (gray circles), and 10° (gray triangles), respectively. Continuous lines are weighted running averages through the data. C, Compression and shift of the three apparent bar positions for a given point of time with respect to saccade onset for the same two subjects. The shift is calculated as the average of the three apparent bar positions normalized to the average apparent bar positions 100 ms before and after saccade onset, respectively. Space compression is calculated as the mean separation between apparent bar positions normalized to mean separation between real bar positions. D, Saccade peak velocities of the same two subjects, plotted against saccade amplitudes.

