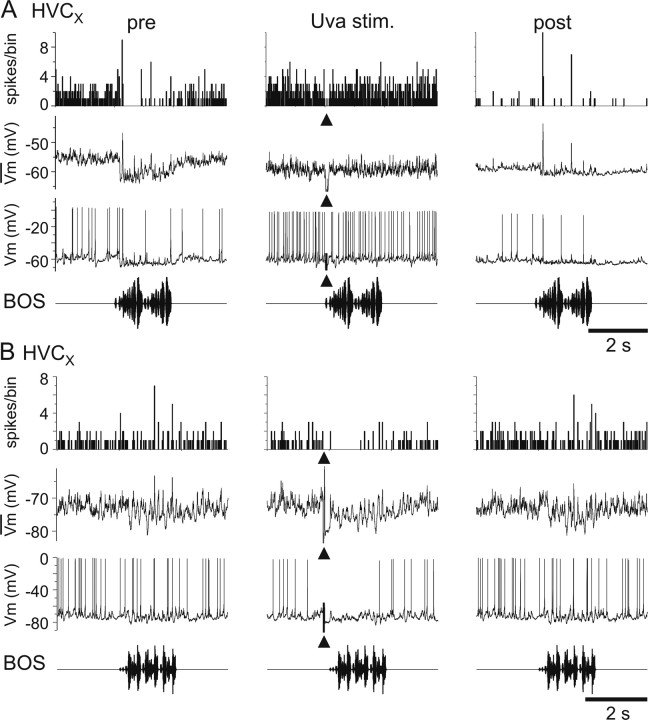
Figure 10.
High-frequency Uva stimulation had a mixed effect on BOS-evoked auditory response in HVCX neurons. A, B, Bottom row, Oscillogram of BOS presentation. Third row, Raw trace of the response of each HVC neuron to a single playback of BOS. Second row, Median filtered, average membrane potential. Top row, PSTH for spikes generated. A, Uva stimulation resulted in a removal of inhibition in a subset of HVCX neurons. Left column, Before Uva stimulation, the HVCX neuron was inhibited during playback of BOS. Middle column, Stimulation of Uva (5 50-ms trains at 200 Hz and 5 50-ms trains at 333 Hz, 20 μA) 200 ms before BOS playback (arrow) resulted in the removal of this inhibition, and the HVCX neuron fired action potentials throughout BOS playback. Right column, After Uva stimulation, the HVCX neuron was inhibited during BOS playback. The neuron is less active after Uva stimulation attributable to a slight, spontaneous hyperpolarization of the membrane potential, which is common for these cells and not the result of Uva stimulation. Ten iterations of BOS were presented for each stimulus. Tonic depolarizing current (+0.24 nA) was injected into the neuron throughout the recording to accentuate the inhibition. B, Uva stimulation inhibited some HVCX neurons. Left column, Before Uva stimulation, BOS presentation elicited hyperpolarizing IPSPs in the HVCX neuron. Stimulation of Uva (50 ms train at 400 Hz, 20 μA) 200 ms before BOS presentation resulted in an initial hyperpolarization of the membrane potential and a reduction in spiking. Right column, The response of the neuron to BOS presentation recovered after Uva stimulation. Five iterations of BOS were presented for each stimulus. Bin size, 25 ms.

