
Figure 11.
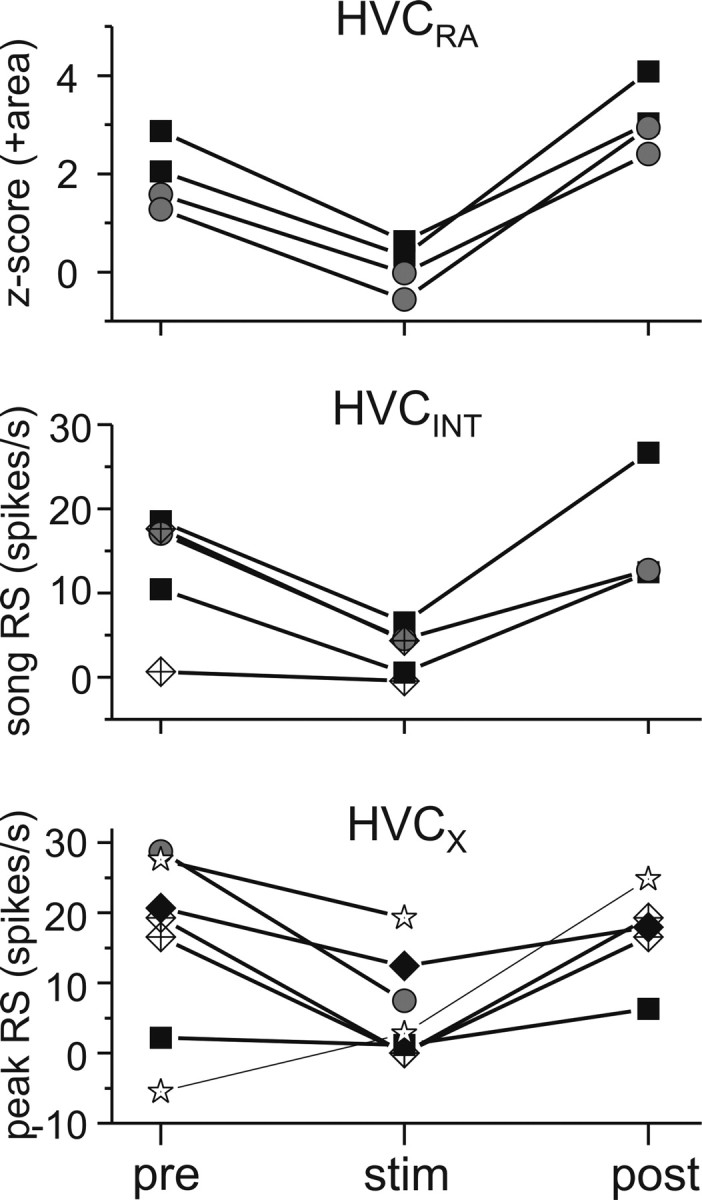
Summary of the effect of high-frequency Uva stimulation on individual HVC neurons. Top, The effect on HVCRA neurons was measured by the z-score value in area of subthreshold membrane potential to the whole song playback (n = 4 stimulus trials in 2 birds). Uva stimulation evoked a significant decrease in z-score area compared with pre-Uva stimulation values (p < 0.01, paired t test). Middle, The effect of Uva stimulation on HVCINT neurons was measured with the response strength throughout song presentation (n = 5 stimulus trials in 3 birds). Uva stimulation resulted in a significant decrease in HVCINT neurons response strength (p < 0.01, paired t test). Bottom, The effect of Uva stimulation on HVCX neurons was measured using the response of the peak HVCX firing compared with a comparable baseline firing rate (n = 7 stimulus trials in 4 birds). Uva stimulation resulted in a marginally significant decrease in HVCX peak RS (p = 0.056, paired t test). For each graph, each point is the average for 5–10 iterations of BOS playback.