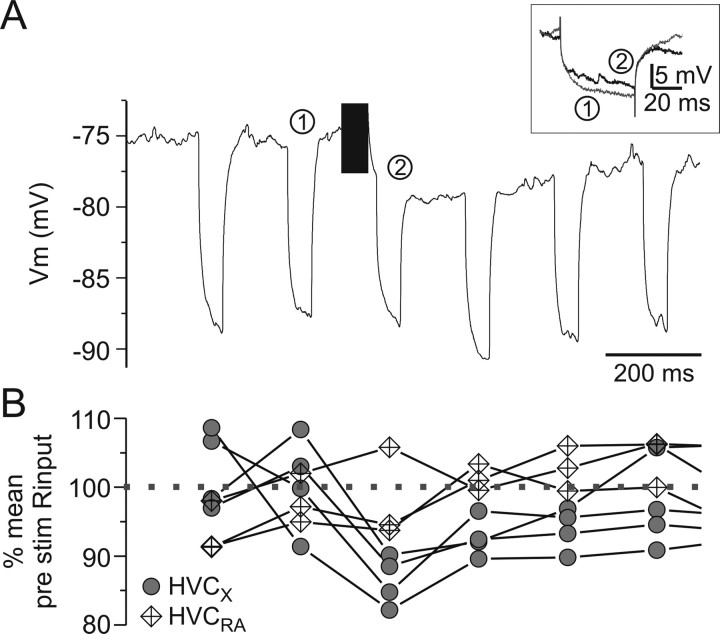
Figure 12.
Uva stimulation results in a decrease in the input resistance (Rinput) of all HVC projection neurons. A, The Rinput of an HVCX neuron was monitored with current pulses (−0.3 nA, 200 ms interpulse interval, 50 ms pulse duration). Immediately after Uva stimulation, the Rinput decreased. The trace is the average change in membrane potential over 10 trials. Inset, Comparison of the change in voltage to injected current before (black line) or after (gray line) Uva stimulation. The numbers indicate which current pulse is illustrated. B, Change in Rinput for all HVC projection neurons tested. Each value is the percentage Rinput of the average (over 8 pulses) pre-Uva stimulation. Gray circles, HVCX neurons (n = 4); diamonds, HVCRA neurons (n = 3). Compared with the mean Rinput before Uva stimulation, Rinput in HVCX neurons was marginally different only immediately after Uva stimulation (first current pulse only, repeated-measures ANOVA, least significant difference post hoc, p = 0.055). Rinput of HVCRA neurons was not significantly different from the mean pre-Uva stimulation Rinput (repeated-measures ANOVA, p > 0.05).

