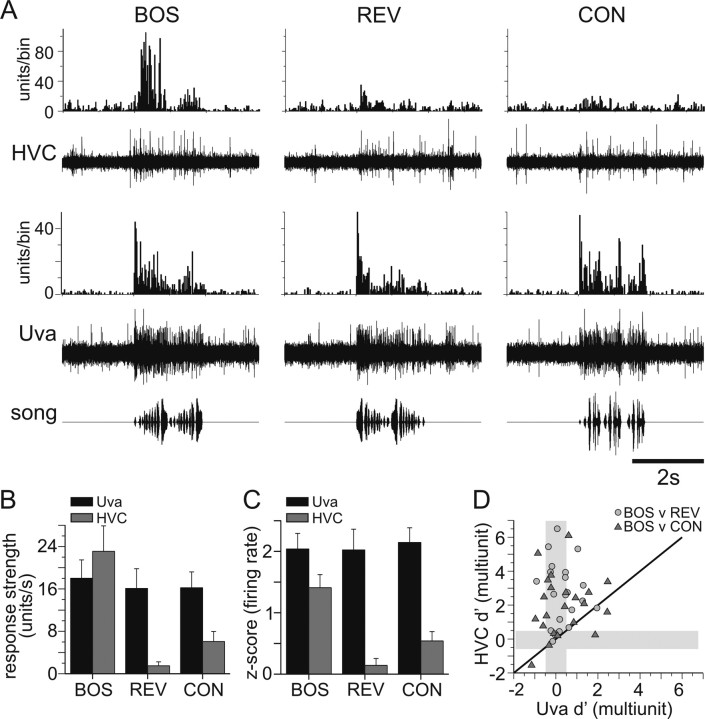
Figure 4.
Comparison of simultaneously recorded multiunit activity in Uva and HVC. A, Auditory responses from simultaneous multiunit recordings in HVC and Uva. Bottom row, Oscillograms of auditory stimuli. Fourth row, Raw trace of Uva multiunit response to a single iteration of each auditory stimulus. Third row, PSTH of the multiunit response in Uva to 20 iterations of each stimulus. Response strengths were as follows: BOS, 21.4; REV, 16.3; CON, 22.8; for all, p < 0.01. d′ values were as follows: BOS vs REV, 0.65; BOS vs CON, −0.18. Second row, Simultaneously recorded raw trace of multiunit response in HVC to a single playback of each auditory stimulus. Top row, PSTH of the multiunit response in HVC to 20 iterations of each stimulus. Bin size, 25 ms. HVC neurons are selective for BOS over the other two stimuli. Response strengths were as follows: BOS, 30.4; REV, 7.2; CON, 4.9; for all, p < 0.01. d′ values were as follows: BOS vs REV, 2.52; BOS vs CON, 0.88. B, C, On average, Uva neurons respond equally well to all auditory stimuli, whereas HVC responds selectively to BOS. B, Summary of response strength of multiunit activity in Uva (black bars; n = 22) and HVC (gray bars; n = 20) to each auditory stimulus, including BOS, REV, and CON. Error bars indicate SEM. C, z-score value of the multiunit firing rate of Uva and HVC. D, Uva and HVC activity do not have similar selectivity for BOS over non-BOS stimuli. The d′ values (BOS vs REV, circles; BOS v CON, triangles) for HVC firing rate are plotted against the d′ values for simultaneously recorded Uva firing rates. Black diagonal line is the unity line. The gray bars are regions of nonselectivity, −0.5 < d′ < 0.5, for each recording site.

