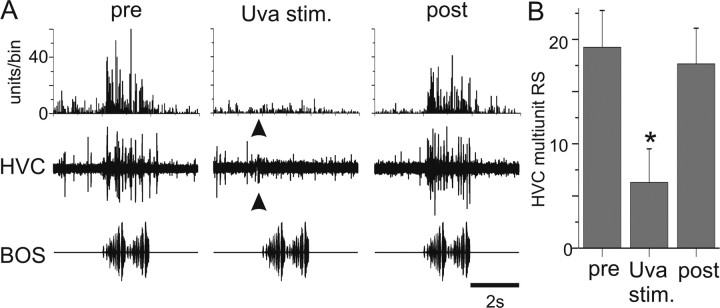
Figure 8.
A, High-frequency (400 Hz) Uva stimulation suppresses multiunit activity in HVC. Bottom row, Oscillogram of BOS. Middle row, Raw trace of the multiunit response of HVC to a single playback of BOS. Top row, PSTH of HVC multiunit activity to 10 iterations of BOS. Left column, HVC multiunit activity increases in response to playback of BOS before Uva stimulation. HVC RS of 38.8 units/s. Middle column, HVC activity is reduced when Uva is stimulated (arrowhead; 20 μA, 50 ms train at 400 Hz, 200 ms before BOS onset). RS of 2.16 units/s. The stimulus artifact was reduced in both the raw trace and the PSTH. Right column, HVC response to playback of BOS recovered when Uva was no longer stimulated before BOS presentation. RS of 38.27 units/s. This is from the same Uva recording site shown in Figure 2A. Bin size, 25 ms. B, Summary of the effect of Uva stimulation on BOS-evoked multiunit auditory activity in HVC. RS: pre, 18.8 ± 3.7 units/s; Uva stim., 6.1 ± 3.4 units/s; post, 17.6 ± 3.4 units/s. Error bars represent SEM. *p < 0.05, Uva stimulation is significantly less than either pre- or post-Uva stimulation (ANOVA).

