
Figure 1.
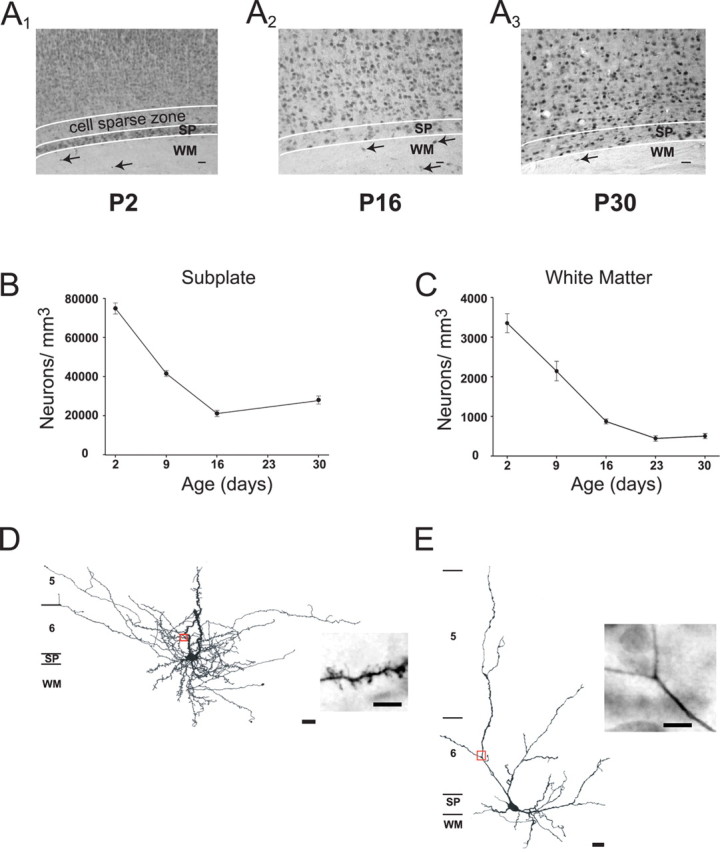
SP and WM cells decrease in density during the first month postnatally. A, Representative examples of NeuN-stained rat visual cortex at P2 (A1), P16 (A2), and P30 (A3). Filled arrows indicate WM cells at each age. B, C, Plots of neuronal density of SP (B) and WM (C) cells during the first month after birth in rat visual cortex. A developmental decrease was observed in both populations. D, E, Camera lucida drawings of a spiny (D) and smooth (E) SP cell. Insets are photomicrographs of the area of dendrite indicated by the red box in each drawing. Approximate location of the layers is indicated on the left of each drawing. Scale bars: photomicrographs, 50 μm; drawings, 20 μm; insets, 5 μm.