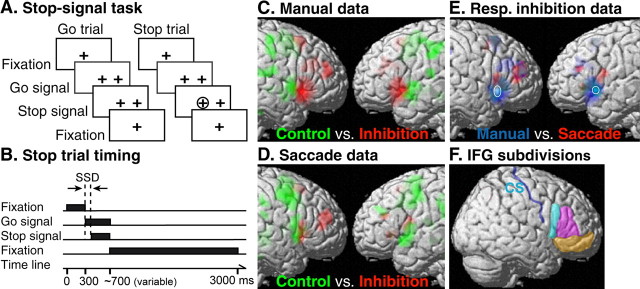
Figure 1.
Stop-signal paradigm and cortical activations during stopping hand and eye movements. A, Visual events were the same for go trials and stop trials of the manual and saccade stop-signal tasks. The appearance of a peripheral target (go signal) indicates whether to make a left or a right response, whereas the appearance of a circle (stop signal) at the center shortly after the go signal indicates that the planned response should now be canceled. B, Timing of visual events during a stop trial. SSD is the interval between the go and stop signal. SSD was assigned individually to equate performance across response modalities and across subjects. C, Activations corresponding to manual response inhibition (red) and hand motor control (green) are shown on the right and left hemispheres of the rendered MNI single-subject brain. D, Activations corresponding to saccade inhibition (red) and saccade control (green). E, Activations corresponding to manual response inhibition (blue) and saccade inhibition (red) and their overlap (whiter color). White circles mark the locations of overlapping activations in the ventral IFG. For the exact locations of the overlapped activations, refer to Figure 2 and Table 1. F, IFG subdivisions in the right hemisphere: cyan area, pars opercularis; magenta area, pars triangularis; orange area, pars orbitalis. The central sulcus (CS) is traced with a blue line. Note that activations for response inhibition in each response modality were derived from stop–go contrast, whereas activations for hand motor and saccade control were derived from hand/saccadic responses relative to the fixation baseline. Threshold is p < 0.001 (uncorrected, cluster size of at least 9).

