
Figure 3.
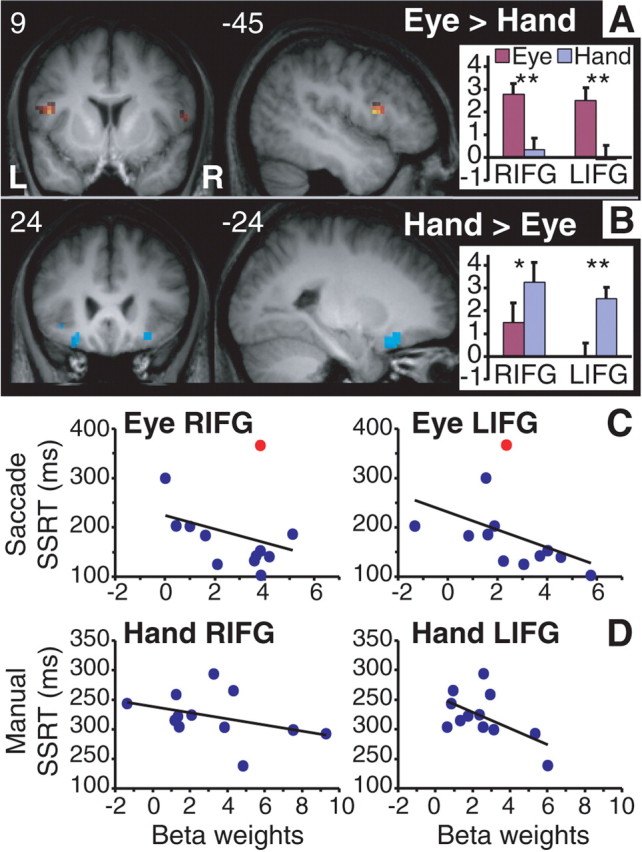
Differential activations in ventral IFG in response inhibition. A, A more dorsal part of the IFG showed stronger activity in inhibiting eye movements relative to inhibiting hand movements. B, A more ventral part of the IFG showed stronger activity in inhibiting hand movements relative to eye movements. Activation data shown in A and B (p < 0.01, uncorrected; cluster size of at least 9) are masked, respectively, by the saccade and the manual stop–go contrast. See Table 1. Insets on the right show the corresponding bar charts of the average beta values and SEs of the activation clusters (extracted from the maps on the left) for each response modality. The number on the left corner of each slice indicates the y-coordinates for coronal slices and x-coordinates for sagittal slices. L, Left; R, right; paired t tests, *p < 0.02, **p < 0.002. C, Scatter plots of saccade SSRT (y-axis) and beta weights (x-axis) for the right (RIFG) and left (LIFG) activation clusters (in A) across all subjects. The red dot indicates the subject whose SSRT in the saccade stop-signal task was 2 SDs from the mean. D, Scatter plots of manual SSRT (y-axis) and beta weights (x-axis) for the activation clusters (in B) across all subjects. Note that shorter SSRT is associated with higher fMRI signal in all the plots. For r2 values, see Results.