Figure 1.
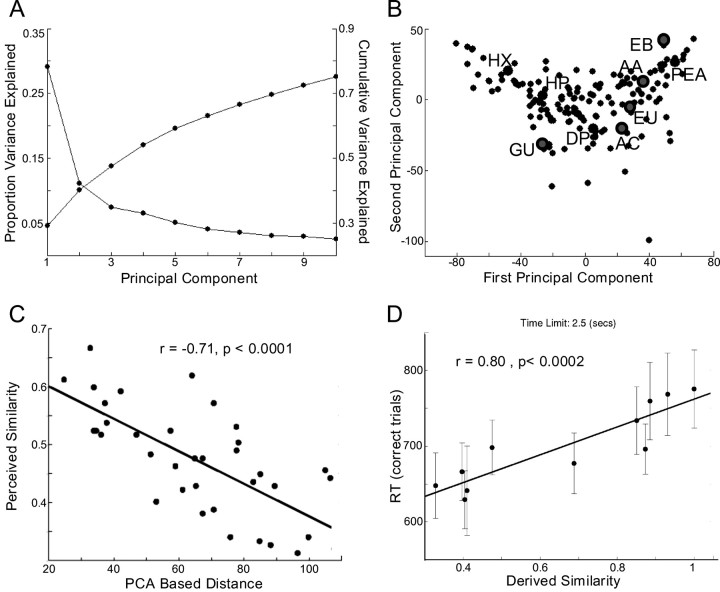
Olfactory perceptual space. A, The proportion of variance in perceptual descriptions is explained by each of the PCs (starting at ∼0.3), and the cumulative variance is explained (starting at ∼0.05). B, The 144 odorants projected into a two-dimensional space made of the first and second PCs. The nine odorants used in experiment 1[acetophenone (AC), amyl acetate (AA), diphenyl oxide (DP), ethyl butyrate (EB), eugenol (EU), guaiacol (GU), heptanal (HP), hexanoic acid (HX), and phenyl ethanol (PEA)] are in enlarged circles, and the five odorants used in experiment 2 (acetophenone, amyl acetate, ethyl butyrate, eugenol, guaiacol) are in further enlarged circles. C, For the nine odorants, the correlation between explicit perceived similarity ratings and PCA-based distance for all pairwise comparisons. Odorants closer in the perceptual space were perceived as more similar. D, Reaction time for correct trials in a forced-choice same-different task using five of the nine odorants. Error bars reflect SE. The reaction time was longer for odorant pairs that were closer in PCA-based space, thus providing an implicit validation of the perceptual space.

