
Figure 2.
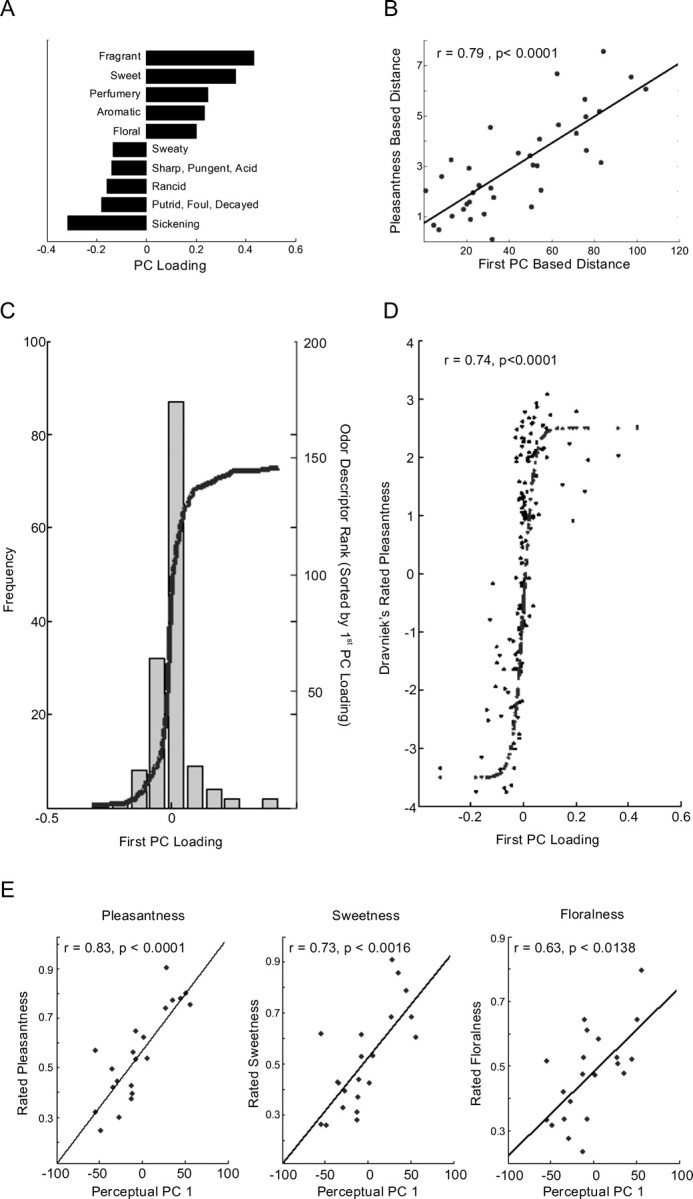
Identifying pleasantness as the first PC of perception. A, The five descriptors that flanked each end of PC1 of perception. We should stress that here, and in Figure 3B, we show the five extreme descriptors only to help give a sense of the PC. This does not reflect a cutoff in any stage of the analysis, but only an esthetic cutoff for the figure. B, For the nine odorants, the correlation between the pairwise difference in pleasantness and the pairwise distance along the first PC. Distance along the first PC was a strong predictor of difference in pleasantness. C, The 146 perceptual descriptors plotted as a function of their weighting on the first PC of perception. D, The previously published pleasantness associated with each one of the 146 perceptual descriptors. The descriptors clearly weighted on the first PC of perception in accordance with their pleasantness. E, We randomly selected 21 odorants tested previously by Dravnieks (1982, 1985) (acetyl pyridine, benzaldehyde, amyl acetate, camphor dl, celeriax, citral, dimethyl pyrrole2,5, eugenol, heptanal, hexanoic acid, hexanol1, hexanol3, indole, methyl-iso-borneol2, methyl quinolinepara, octanol1, octenol-1–3-OL, phenyl ethanol, skatole, vanillin) and had 22 subjects rate all odorants using three scales with VAS extremes of “not at all flowery” versus “extremely flowery,” “not at all sweet” versus “extremely sweet,” and “extremely unpleasant” versus “extremely pleasant.” The order of VAS scales was counterbalanced. Judgments were converted to z-scores for each subject, and scores for odorants averaged across subjects. We then regressed these normalized ratings against the PC1 values for these odorants.