Figure 4.

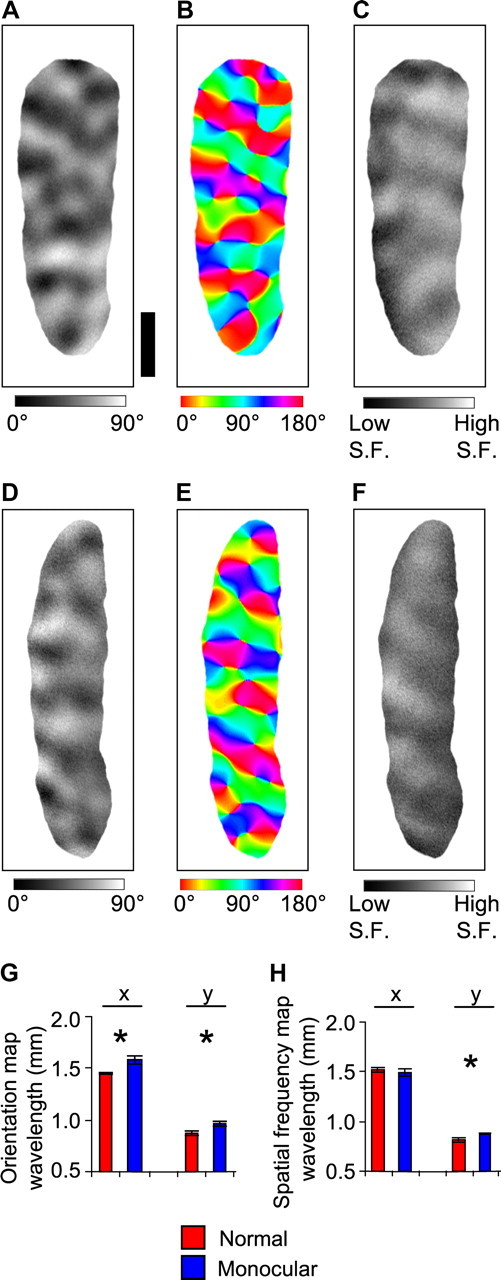
Maps of orientation and spatial frequency in normal and monocular ferrets. A, D, Differential orientation maps from a normal ferret (A) and from the cortex contralateral to the remaining eye in a monocular ferret (D), comparing the cortical response to 0° and 90° grating stimulation. B, E, Orientation angle maps from a normal ferret (B) and from a monocular ferret (E). Each pixel is color coded according to its preferred orientation. C, F, Differential spatial frequency (S.F.) maps in V1 from a normal ferret (C) and from a monocular ferret (F), comparing the cortical response to 0.08 and 0.225 cycle/° stimulation. G, The orientation map wavelength, measured using Fourier analysis along the x (horizontal, anteroposterior) dimension and the y (vertical, mediolateral) dimension of cortex. Error bars denote SEM over 10 normal ferrets and 12 monocular ferrets. H, The spatial frequency map wavelength, measured using Fourier analysis along the x (horizontal) dimension and the y (vertical) dimension of cortex. Error bars denote SEM over five normal ferrets and seven monocular ferrets. Scale bar: (in A) A–F, 1 mm.
