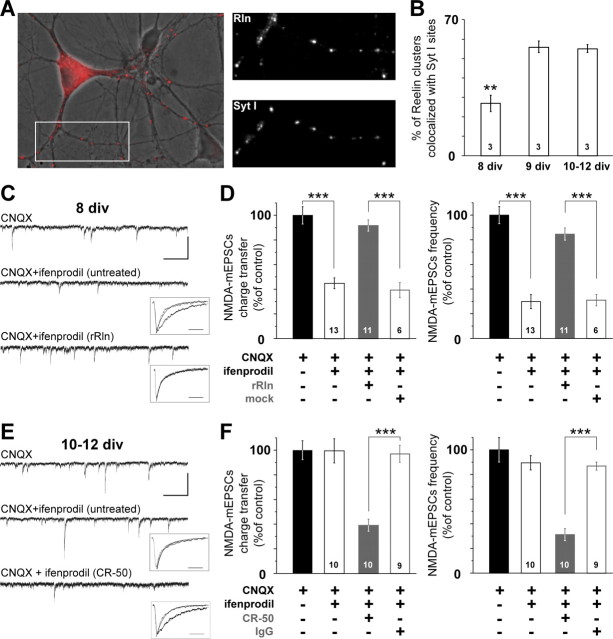
Figure 1.
Reelin controls the subunit composition of synaptic NMDAR during maturation. A, Left, Overlaid pseudocolor image of Reelin labeling (red) and the corresponding differential interference contrast image in a 12 div culture showing a marked punctuate labeling on neurites. Right panels show higher-magnification views of neurites labeled with anti-Reelin and anti-SytI antibodies of the area boxed at the left. B, Synaptic enrichment of Reelin during maturation. Percentage ± SEM of Reelin-positive puncta colocalized with Syt I immunoreactivity (n = 3 cultures; F(2,6) = 27.7; **p < 0.01). C, Representative 15 s recordings of NMDA–mEPSCs with CNQX (top) or CNQX plus ifenprodil in a untreated neuron (middle) or rRln-treated neuron (bottom; calibration: 50 pA, 2 s). Insets, Averaged and scaled NMDA–mEPSCs before (black) and after ifenprodil application (gray) taken from the illustrated cells. The decay phases were best fitted with a monoexponential (solid traces; calibration, 50 ms) (see Materials and Methods). D, Effect of ifenprodil on NMDA–mEPSC charge transfer and frequency in untreated conditions (open black) and after rRln treatment (gray) or the mock control (open gray). Values obtained with CNQX were expressed as a percentage of the mean CNQX value. Black bars represent the percentage average ± SEM obtained in untreated neurons in CNQX (i.e., control). The effect of ifenprodil is expressed as percentage of CNQX ± SEM obtained in each condition. ANOVA revealed significant differences between the various conditions for charge transfer (F(3,39) = 27.4) and frequency (F(3,39) = 44.9). ***p < 0.001. The number of neurons recorded in each condition is indicated. E, Representative 15 s recordings of NMDA–mEPSCs in the presence of CNQX (top) or CNQX and ifenprodil in either untreated neuron (middle) or neuron treated with CR-50 (bottom; calibration: 50 pA, 2 s). Inset, Same legend as C. F, Same legend as D but instead neurons were chronically treated with CR-50 (gray) or a control IgG (open gray). ANOVA revealed significant differences between untreated, CR-50, and mock conditions for charge transfer (F(3,35) = 28.9) and frequency (F(3,35) = 21.3). ***p < 0.001.

