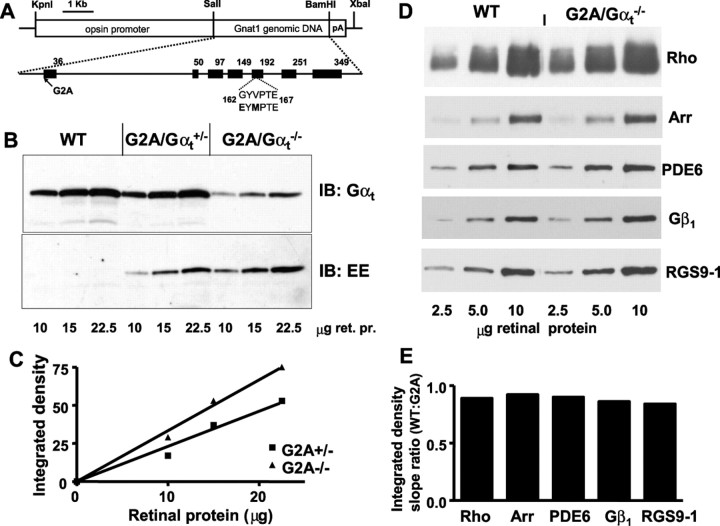
Figure 1.
A, Transgenic construct used for the generation of mutant GαtG2A mice. B, Expression levels of G2A mutant in GαtG2A/Gαt+/− and GαtG2A/Gαt−/− mice. Retinas from transgenic and control (Gαt+/+) mice were homogenized and subjected to SDS-PAGE. Sample loads are in micrograms of retinal protein (ret. pr.). Immunoblot (IB) analysis was performed with anti-rod Gαt and anti-EE antibodies. C, Quantification of protein levels from the anti-EE antibody immunoblot in B. The relative level of GαtG2A in GαtG2A/Gαt−/− mice is 1.5-fold higher than in GαtG2A/Gαt+/− mice (calculated as the ratio of the linear fit slopes). D, Immunoblot analyses of key phototransduction proteins. Samples contained 2.5, 5, and 10 μg of retinal homogenate from 4-month-old GαtG2A/Gαt−/− or control WT mice. The antibodies are described in Materials and Methods. E, Quantification of the relative protein levels from the immunoblot in D. Integrated densities for each protein band were plotted as a function of retinal homogenate load to determine the linear fit slopes and the ratios of the slopes for WT and mutant mice. Arr, Arrestin.

