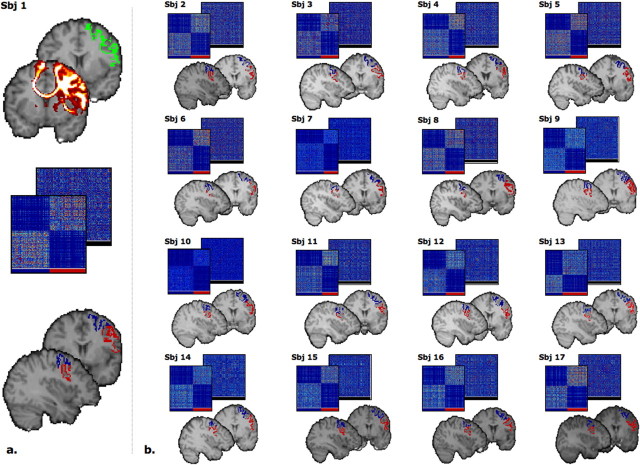
Figure 1.
a, Summary of the steps leading to the PMd/PMv clustering in an example subject (Sbj). Top, PM region (green) and the resulting tracts. Middle, Cross-correlation matrix (and its reorganized counterpart) indicating the degree of similarity in connectivity pattern between the voxels in PMd and PMv, respectively. Bottom, The two resulting clusters on a coronal (y = 63) and a sagittal (x = 63) slice. b, Results of the connectivity-based clustering for the other 16 subjects. Note the recurrent presence of a sharp border between the two clusters.

