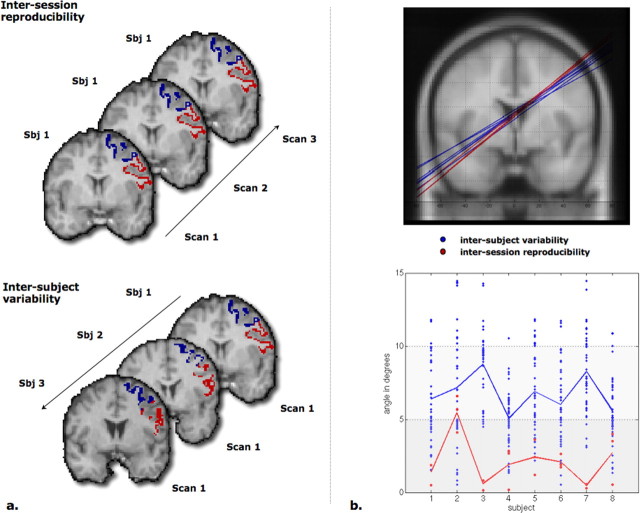
Figure 2.
Results of the reproducibility study. a, Schematic representation of the intersession reproducibility (same subject, different scanning sessions) and the intersubject variability (different subjects, same session). Sbj, Subject. b, Top, Planes dividing PMd and PMv automatically calculated by the SVM classifier for subject 1 (red; three sessions) and subjects 2–8 for session 1 (blue) on the left hemisphere. Bottom, For each subject, the ordinate represents the angle in degrees between the plane identified from session 1 and the other sessions (red; intrasubject variability) or the other subjects for all sessions (blue; intersubject variability). The figure illustrates that there is little variability between subjects and even less variability within subjects.

