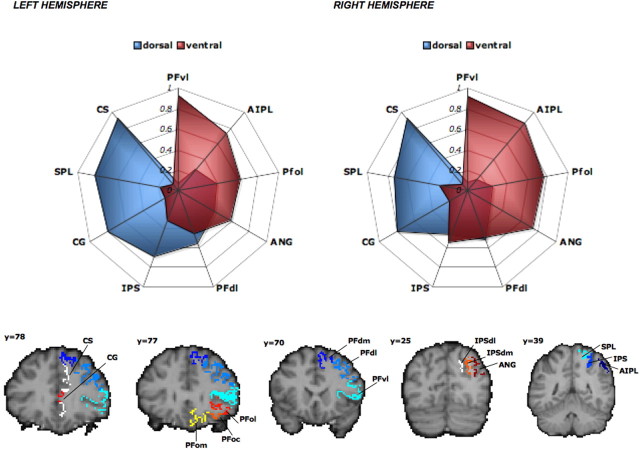
Figure 3.
Connectivity fingerprints in the left hemisphere (top left) and the right hemisphere (top right). The values indicate the relative connection probability between PMd (blue) or PMv (red) and the prefronto-parietal targets, the masks of which are shown in the bottom row. Abbreviations as in Table 1.

