
Figure 5.
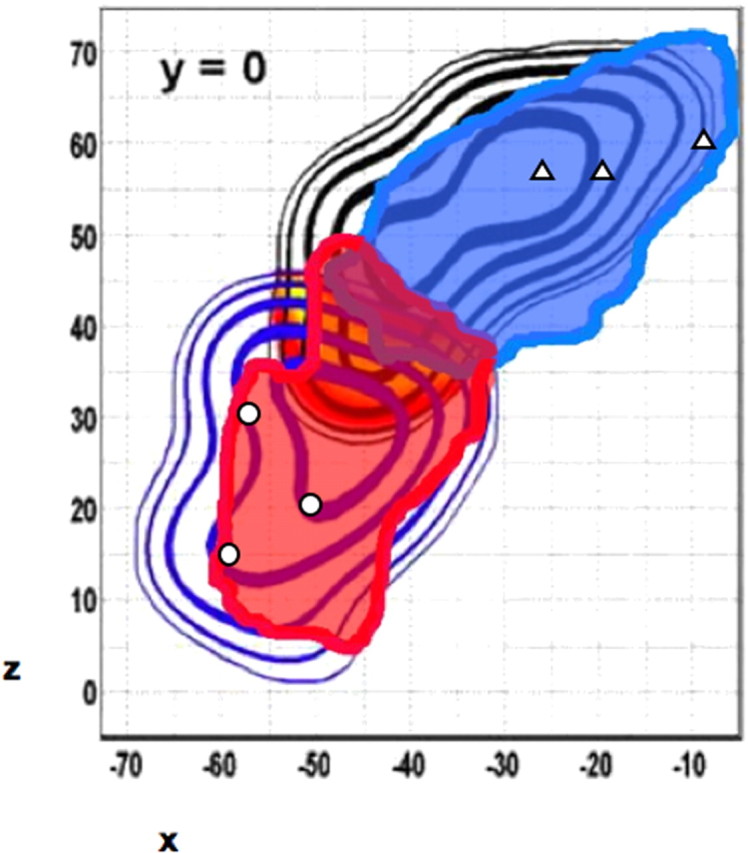
Overlay of the group PMd/PMv parcellation (foreground) on the functional MRI mapping given by the meta-analysis of Mayka et al. (2006) (background). It shows a very close correspondence between the functional and the connectivity-based borders of the two premotor subregions. Open symbols represent the x,z coordinates of functional activations from specific individual studies projected onto our connectivity-based map at y = 0. Triangles represent activations from three studies of conditional motor selection (Toni et al., 2001; Amiez et al., 2006; Grol et al., 2006) that fall within putative PMd (blue), and open circles represent locations of functional activations from three studies of reaching and grasping (Binkofski et al., 1999b; de Jong et al., 2001; Ehrsson et al., 2003) that fall within putative PMv (red).