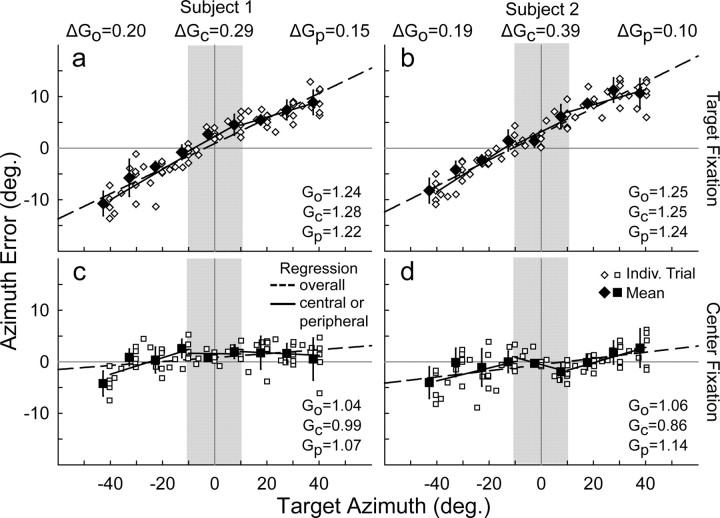
Figure 3.
Sound localization accuracy (error between response and target location) in azimuth for target (a, b) and Ctr (c, d) fixation tasks from two representative subjects (a and c vs b and d). Each point (open symbols) is the error for a single trial. Mean error values for the multisampled targets (solid symbols) are offset slightly to the left for clarity. Spatial gain (G) was calculated as the slope of the response versus target relationship. G is equivalent to the slope of the error versus target relationship (as displayed here), plus 1.0. Positive and negative slopes (i.e., G >1.0 or <1.0) indicate response overshoot and undershoot, respectively. Go is overall gain (dashed lines) across the entire frontal field (see Fig. 2c, shaded area). Gc and Gp are central (limited to ±10° azimuth; shaded area) and peripheral (more than ±10° or less and ≥10° azimuth) gains, respectively (solid lines). ΔG values (shown above a and b) indicate the difference in spatial gain between target and Ctr fixation. The two subjects showed comparable changes in overall spatial gain but contrasting changes in central and peripheral gains between the two tasks. Indiv. Trial, Individual trial.

