
Figure 5.
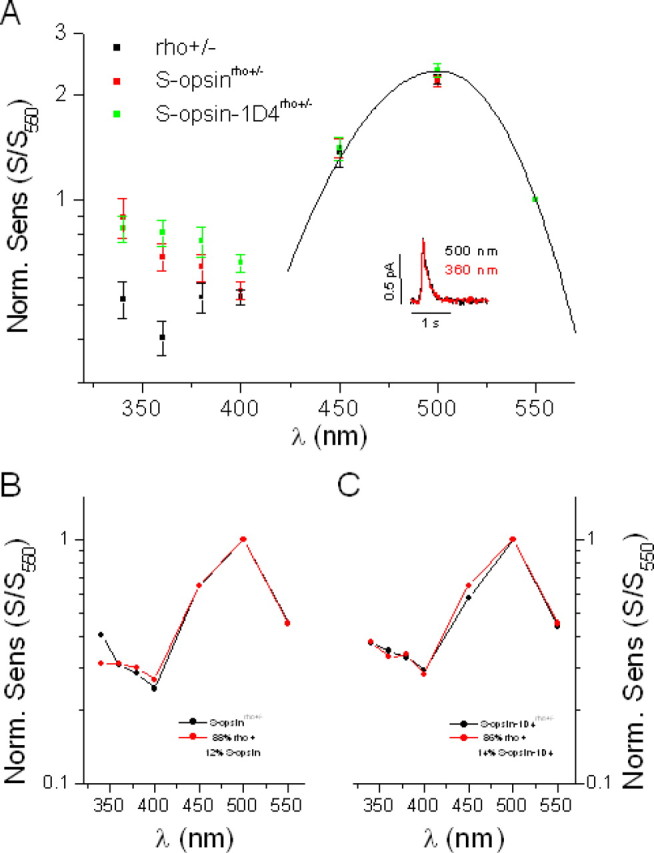
Transgenic expression of S-opsin in rho+/− rods enhances their sensitivity to UV light without affecting their response properties. A, Comparison of spectral sensitivities of control rho+/− rods (black), transgenic S-opsinrho+/− rods (red), and transgenic S-opsin-1D4rho+/− rods (green). Spectral sensitivities are shown normalized at 550 nm, where contribution of S-pigment to the overall action spectrum in the transgenic cells is negligible (Fig. 4C). This point is also supported by the good fit at long wavelengths of both control and transgenic action spectra to the rhodopsin A1 template with λmax = 500 nm (solid line). The inset shows the similar amplitudes and kinetics of the single photon responses from one S-opsinrho−/− rod at 500 nm (black) and 360 nm (red). B, The action spectrum of S-opsinrho+/− rods (black) can be fit by a combination of the action spectra of rho+/− rods (Fig. 5A) and S-opsinrho−/− rods (Fig. 4C) in an 88%:12% ratio (red). C, Similar fit for the S-opsin-1D4rho+/− rod action spectrum (black) with an 86%:14% ratio of rho+/− and S-opsin-1D4rho+/− rod spectra (red). Error bars indicate SEM.