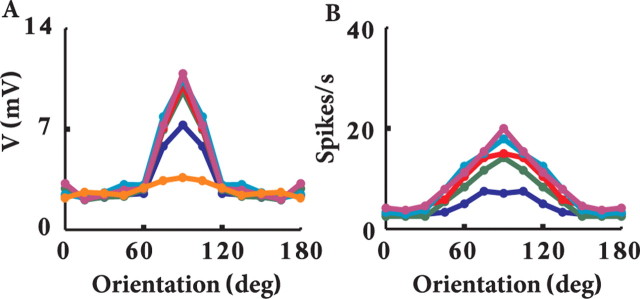
Figure 10.
Membrane voltage fluctuations and aspect ratio for the strong depression parameters. A, Tuning curve of the peak-to-peak fluctuations of the averaged voltage for different contrasts (colors as in Figs. 5–9). B, Tuning curve of the spikes for a model with subfield aspect ratio of 1.75. The tuning curve is broader than for an aspect ratio of 3.3 (as was used throughout), but it remains contrast invariant.

