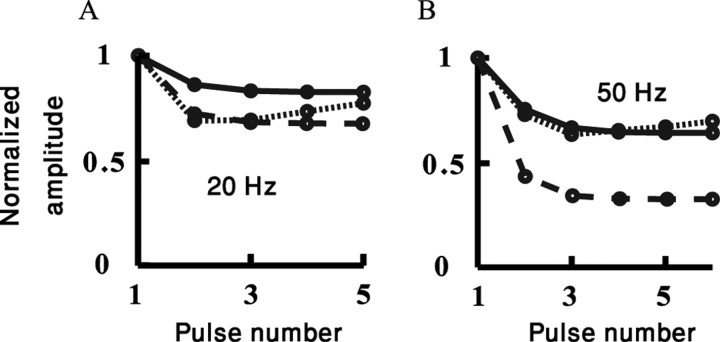
Figure 6.
Fit of modeled dLGN-to-SSC depressing synapses to a train of stimuli. The amplitude of the nth EPSP in a train is shown as a function of the pulse number in the train at 20 Hz (A) and 50 Hz (B). Responses are normalized to the first EPSP amplitude. Dotted line, In vivo recordings, monosynaptic input (Boudreau and Ferster, 2005); continuous line, model with moderate depression; dashed line, model with strong depression. Note the similarities in depression for the 20 Hz and the differences in depression for the 50 Hz dLGN stimulation.

