
Figure 8.
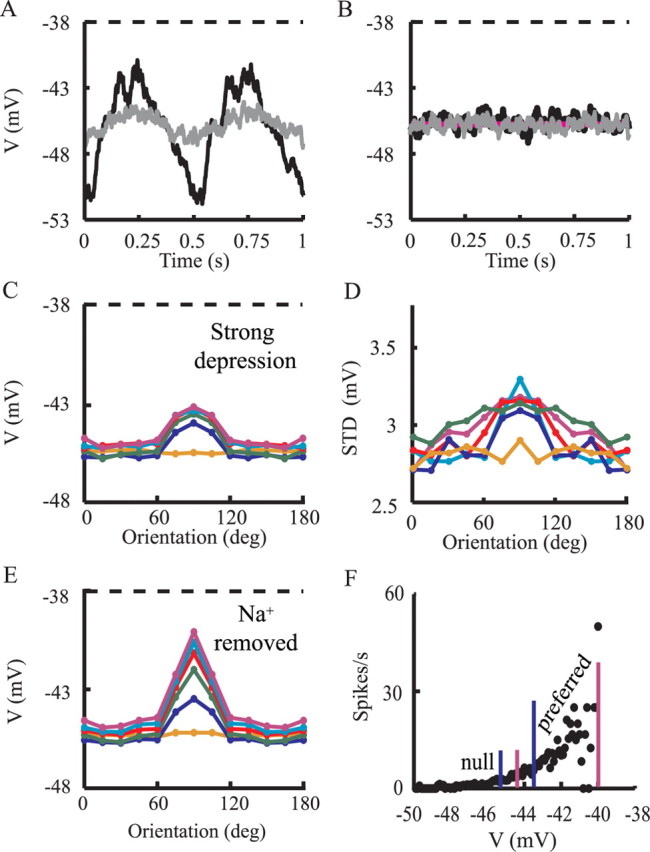
Membrane voltage responses to visual stimuli. A, Averaged voltage responses for preferred stimuli at contrast of 3% (gray line) and contrast of 100% (black line). Dashed line shows threshold for spike firing. B, Averaged voltage responses for orthogonal stimuli at contrast of 3% (gray) and contrast of 100% (black). Purple line shows average voltage without visual stimulus (background activity as described in Materials and Methods). C, Tuning curve for the peak averaged membrane potential for time bins of 40 ms. D, As in C but for the SD of the membrane potential. E, As in C but for a model without the sodium channels. F, V/f curve for the model. Blue lines (left and right) indicate the average membrane voltage for 10% contrast (at orthogonal and preferred orientations). Pink lines (left and right) indicate the average membrane voltage for 100% contrast (at orthogonal and preferred orientations, respectively).