
Figure 4.
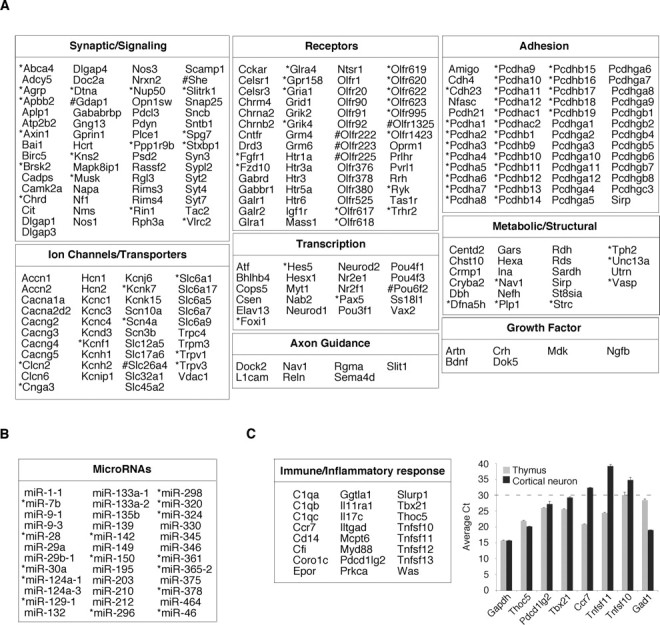
Categorization of putative target genes at SACO-identified REST-binding sites. A, Chart showing genes within 50 kb of SACO-identified RE1 sites, expanded RE1 sites (*), and compressed RE1 sites (#) involved in nervous system development or function. B, Table showing microRNA transcripts within 50 kb of a REST-binding site. C, Left, Table of genes involved in the immune/inflammatory response. C, Right, Quantitative RT-PCR analysis of six T-cell-expressed genes in mature cortical neurons (black bars) and thymus (gray bars). The average Ct for each gene (n = 3) is on the y-axis, and the dotted line demarcates the boundary between genes with moderate-to-high expression levels (Ct < 30) and those that are expressed at low levels (Ct > 30). For comparison, the relative expression of Gapdh, a ubiquitously expressed gene, and Gad1, a neuronal gene, are also shown.