Figure 7.
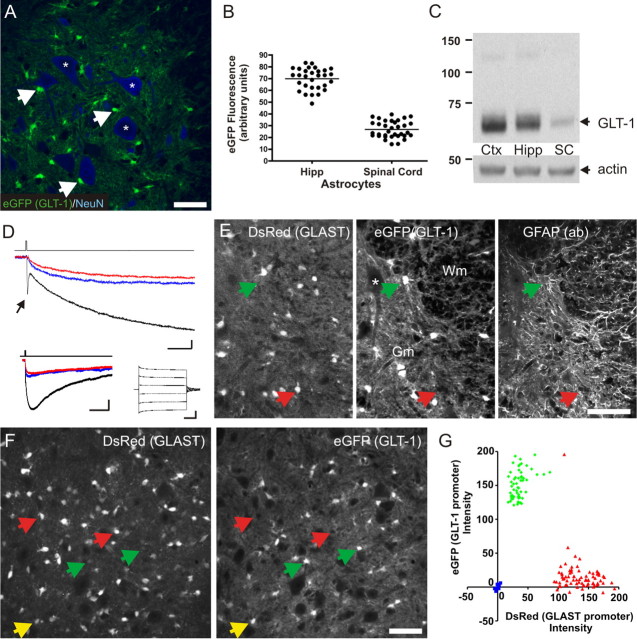
GLT-1 expression by astrocytes in the spinal cord. A, Confocal fluorescent image of the ventral horn of the spinal cord from a GLT-1–eGFP mouse, showing eGFP expression (green) by small cells scattered throughout the neuropil (white arrows). The section was stained with NeuN antibodies (blue) to show the location of motor neurons (somas indicated by asterisks). Scale bar, 50 μm. B, Plot of the eGFP fluorescence intensity of astrocytes in the stratum radiatum region of the hippocampus (Hipp) and the ventral horn of the spinal cord. Values taken from a P24 GLT-1–eGFP BAC mouse; horizontal line represents population average. C, Western blot showing GLT-1 protein levels in mouse cortex (Ctx), hippocampus (Hipp), and spinal cord (SC). This blot is representative of blots made from three different mice of the same age. The actin bands show that equivalent amounts of protein were loaded into each lane. D, Whole-cell recording of glutamate transporter currents from an astrocyte in the ventral horn of a P29 GLT-1–eGFP mouse (identified by eGFP fluorescence) showing responses recorded under control conditions (black trace) and in the presence of DHK (300 μm; blue trace) or TBOA (300 μm; red trace). Calibration: 25 ms, 25 pA. Transporter currents were elicited in response to brief photolysis (duration shown by black trace above) of MNI–d-aspartate (500 μm). Traces at bottom left show responses on a slower timescale, highlighting the slow decay of the putative K+-mediated component. Calibration: 500 ms, 25 pA. Inset at bottom right shows the response of this cell to voltage steps (−50, −30, −10, 10, 30, and 50 mV). Calibration: 50 ms, 1 nA. E, Fluorescent images of the ventral horn from a P24 GLAST–DsRed/GLT-1–eGFP double-transgenic mouse stained with GFAP antibodies, showing colocalization between eGFP and GFAP (green arrow) by astrocytes in the gray matter (Gm). DsRed expression was observed in GFAP− cells (red arrow) in both the gray matter and white matter (Wm). Scale bar, 50 μm. F, Fluorescent image from the ventral horn of a P24 GLAST–DsRed/GLT-1–eGFP double-transgenic mouse showing the extent of overlap between eGFP (green arrows) and DsRed (red arrows). Scale bar, 50 μm. G, Plot of the relative intensities for eGFP (green diamonds) and DsRed (red triangles) among cells in the ventral horn of the spinal cord. Motor neurons (blue squares) did not express either fluorescent protein.

