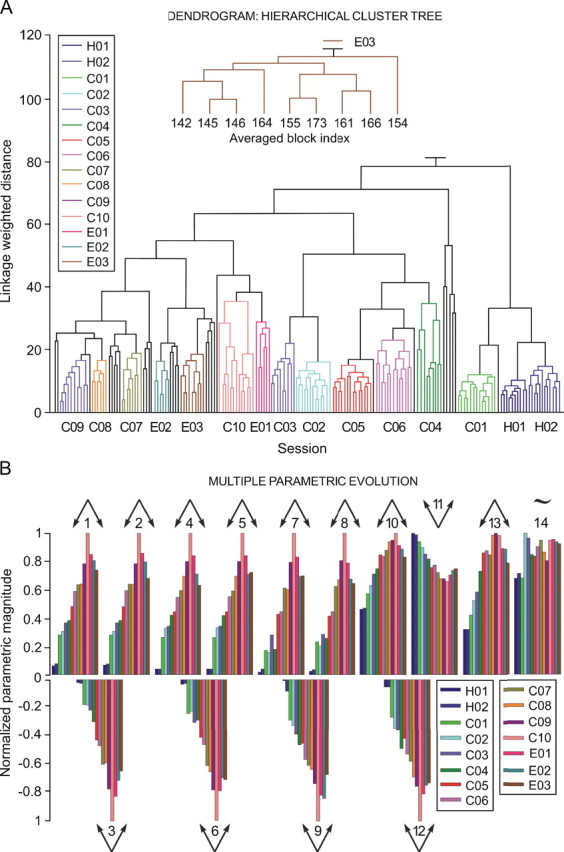
Figure 3.

A representation of the hierarchical cluster tree and of multiparametric evolution of results collected across habituation, conditioning, and extinction sessions. A, This dendrogram illustrates the hierarchical cluster tree constructed from data collected from five animals for each experimental session. A total of 63 orbicularis oculi motoneurons and 71 interpositus neurons were included in the analysis. Quantified parameters are listed in Tables 1 and 2. Each bar at the bottom of the dendrogram represents an averaged conditioning block (see Materials and Methods). The linkage-weighted distance between the objects is represented on the y-axis in arbitrary units. According to the illustrated results, a total of 30 clusters were obtained. The comparison depth was of 16 levels to both sides of the objective level, and the clusters were formed without specifying the maximum number of clusters. The x-axis represents, in colored lines (not black lines), the 15 statistically significant (F(14, 56, 136) > F(15, 60, 140), …, F(29, 116, 150), with Nr = 5; Wilk';s λ = 0.12; and F(14, 56, 136) = 20.1821; p < 0.01) clusters (corresponding to the 2 habituation, 10 conditioning, and 3 extinction sessions), which add up to 151 averaged blocks distributed in the 15 experimental sessions during the delay conditioning paradigm (H01–H02, 22 blocks; C01–C10, 108 blocks; and E01–E03, 21 blocks). The black lines represent the 29 averaged blocks that fall into the remaining 15 statistically nonsignificant clusters. An enlargement of the third extinction session (E03) is presented in the inset, and the order number assigned to each averaged block is indicated. B, Multiple parametric evolution. A total of 14 parameters (4 kinetic and 10 kinematic, see Table 3) were included in this analysis. As illustrated in the inset, each color corresponds to a habituation, conditioning, or extinction session. Each set of color bars corresponds to the evolution of a given parameter (numbered from 1 to 14). Each color bar indicates the mean parametric value resulting from averaging all of the blocks (n = 12) of the same session, a procedure applied for each of the sessions. The Λ arrows indicate that the parameter increases across conditioning sessions (n = 10) and then decreases across extinction sessions (n = 3). The V arrows indicate the opposite. This parametric evolution is analogous to the one observed in typical learning curves using this classical conditioning paradigm. For this representation, the parameters have been normalized according to their maximum absolute values. Parameters 3, 6, 9, and 12 kept their negative values because of the reference system adopted: namely, the eyes of the experimental subject are open at 0° and totally closed at 25–30°.
