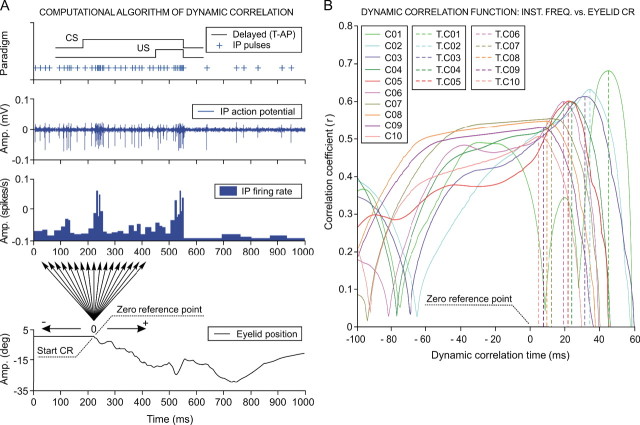
Figure 4.
The dynamic correlation function between interpositus neuron firing and eyelid conditioned responses. A, Computational algorithm of the dynamic correlation. The implementation of the dynamic correlation algorithm during the ninth conditioning session is illustrated. A delay [tone-air puff (T-AP)] conditioning paradigm was used. Note the correspondence, in terms of time and magnitude, between three different representations of neuronal activity recorded in the cerebellar interpositus (IP) nucleus: (1) the temporal localization of the action potential pulses marked with plus signs; (2) the direct representation of the action potentials in the interpositus nucleus; and (3) the resultant instantaneous frequency (in spikes per second). A direct eyelid position record obtained simultaneously with neuronal activity is also shown. The start of the eyelid CR is taken as the zero reference point of the dynamic correlation, and the arrows indicate the dynamic correlation range (±200 ms). The corresponding regression lines and correlation coefficients were determined in steps of 1 ms (i.e., 400 regression lines from each trial, like the one illustrated). B, Dynamic correlation functions. Ten dynamic correlation function curves are represented. Each representation corresponds to the average of all dynamic correlation curves obtained for the trials presenting CRs (n < 10) and collected from all of the blocks (n = 12) of the same conditioning session (C01–C10) for all of the experimental subjects (n = 4 cats). The dynamic correlation interval illustrated extends over the instantaneous frequency representation from −100 ms up to +60 ms to both sides of the zero reference point. There is a significant (F(9, 27, 98) = 161.54, p < 0.01) decrease in the maximum correlation coefficient during conditioning sessions, in parallel with a decrease in the time of occurrence (T.K) of the maximum correlation. The broken lines indicate the T.K (K = C01, …, C10), which are always located to the right of the zero reference point, as indicated in A. Note that correlation coefficients obtained across the successive sessions were statistically significant (F(9, 27, 98) = 37.56; p < 0.01), although their values show only a slight coupling (r coefficient < 0.7) between neuronal activity recorded at the interpositus nucleus and eyelid position during CRs.

