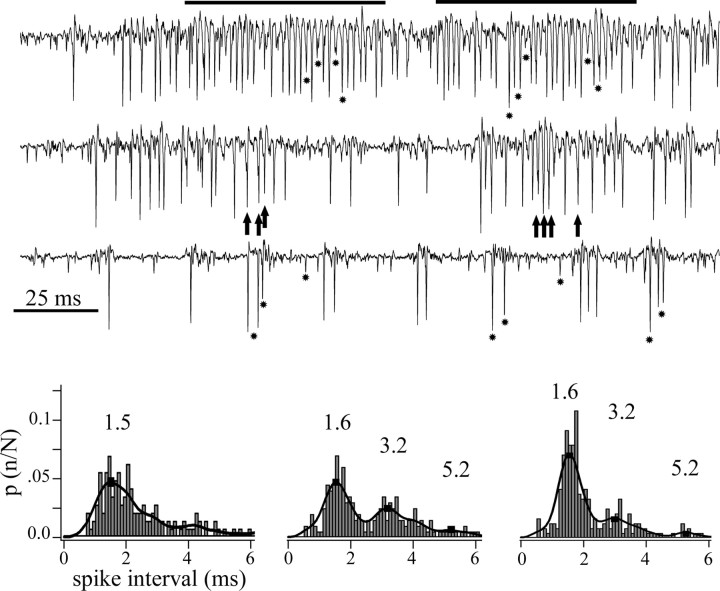
Figure 5.
Imc neurons fired spikes at regular intervals during high-frequency episodes. Extracellular recordings of spikes from one site in Imc, evoked by the movement of a 2° bright dot along the major axis of the collective RF. The traces show examples at high, medium, and low spike rates. At low discharge rates (bottom trace), large-, medium-, and small-sized spikes are clearly discernable (asterisks). At intermediate discharge rates (middle trace), individual spikes began to fuse with each other, as noted by small peaks (arrows) within larger, fused spikes. At higher rates (top trace), more spikes merged into long-lasting episodes of a regular high-frequency discharge (indicated by the horizontal bars), in which individual and fused spikes tended to appear at regular time intervals. Bottom, Collective interspike interval histograms for each level of average discharge rate shown above. Note that, at intermediate (center) and high (right) discharge rates, secondary peak intervals appear that are near multiples of the most frequent one (1.6 ms, corresponding to 600 Hz). To compute the interspike interval, spikes were sorted from the background using a window discriminator with an algorithm that rejected peaks separated by <0.5 ms.

