Figure 1.

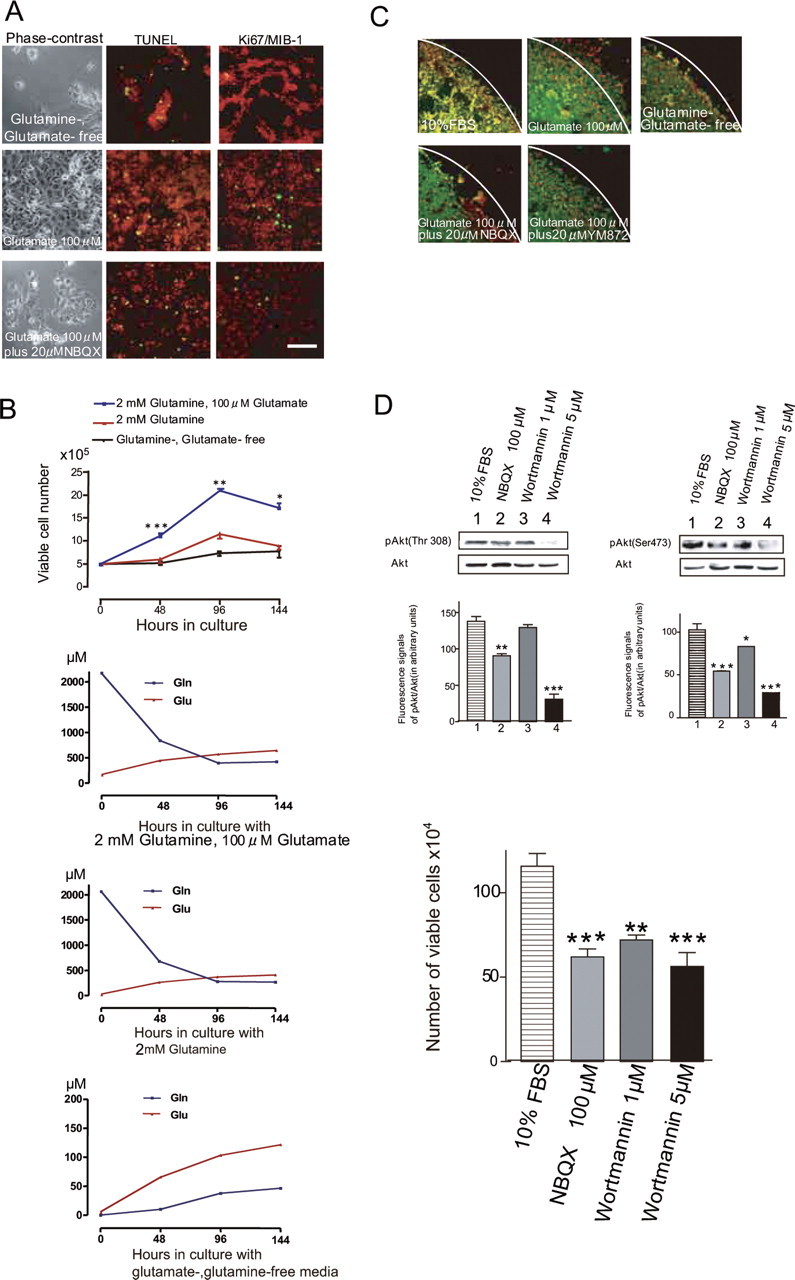
Effects of glutamate on tumor cell proliferation and migration. A, Human glioblastoma cells (CGNH-89) cultured in glutamine-, glutamate-free medium (top row), with 100 μm glutamate (middle row), or 100 μm glutamate plus 20 μm NBQX (bottom row) for 2 d. Phase-contrast micrographs (left column) and results of TUNEL staining (FITC, green; center column) and Ki-67/MIB-1 staining (FITC, green; right column) are shown. The DNA was counterstained with PI (red). Scale bar (in A): A, 50 μm; C, 100 μm. B, Growth curve of viable cells cultured in glutamine-, glutamate-free medium (black line), with 2 mm glutamine (red line), or 100 μm glutamate plus 2 mm glutamine (blue line). Cells (5 × 10⁵) plated in the medium containing 10% FBS were incubated for 12 h, and then the medium was changed to either glutamine-, glutamate-free medium or medium containing 2 mm glutamine or 100 μm glutamate plus 2 mm glutamine for 6 d, respectively. Viable cells were counted after Trypan blue staining. Glutamate significantly promoted tumor cell proliferation (n = 3; *p < 0.05, **p < 0.01, ***p < 0.001). The bottom three graphs showed that determination of extracellular glutamate (glu) and glutamine (gln) in control medium, medium containing 2 mm glutamine, or glutamine-, glutamate-free medium maintained without medium change for 6 d (n = 3). C, Motility assays using a cloning ring. The culture immediately following the removal of the cloning ring after incubation in the medium containing 10% FBS for 24 h (top left) and migratory cells incubated in glutamine-, glutamate-free medium, with or without 100 μm glutamate, or 100 μm glutamate plus 20 μm NBQX or 20 μm YM872 at 24 h after the removal of the cloning ring are shown. Cells were stained with monoclonal antibody for vimentin (FITC, green), and nuclei were counterstained with PI (red). White lines indicate the border of the ring. D, Immunoblotting with anti-phospho-Akt (Thr-308), anti-phospho-Akt (Ser-473), and anti-Akt antibodies for glioblastoma cells, which shows the effects of 100 μm NBQX, 1 μm wortmannin, or 5 μm wortmannin on phosphorylation of Akt. The relative fluorescent signal intensity of pAktThr308 to Akt, and that of pAktSer473 to Akt (in arbitrary units) for each treated cell (n = 3 each) is shown in the graphs below the blots. The amount of Akt phosphorylated at Thr-308 was significantly reduced in cells treated with 5 μm wortmannin (***p < 0.001) compared with the control. The amount of Akt phosphorylated at Ser-473 was significantly reduced in cells treated with 100 μm NBQX (***p < 0.001), 1 μm wortmannin (*p < 0.05), and 5 μm wortmannin (***p < 0.001) compared with the control. E, Effects of NBQX and wortmannin on cell growth. Cells (5 × 10⁵) plated in the medium containing 10% FBS were incubated for 12 h, and then the medium was changed and 100 μm NBQX, 1 μm wortmannin, or 5 μm wortmannin was added for 2 d. Viable cells were counted after Trypan blue staining. A significant decrease in growth was found in cells treated with 100 μm NBQX (n = 3; ***p < 0.001), 1 μm wortmannin (n = 3; **p < 0.01), and 5 μm wortmannin (n = 3; ***p < 0.001) compared with the control.
