Figure 9.

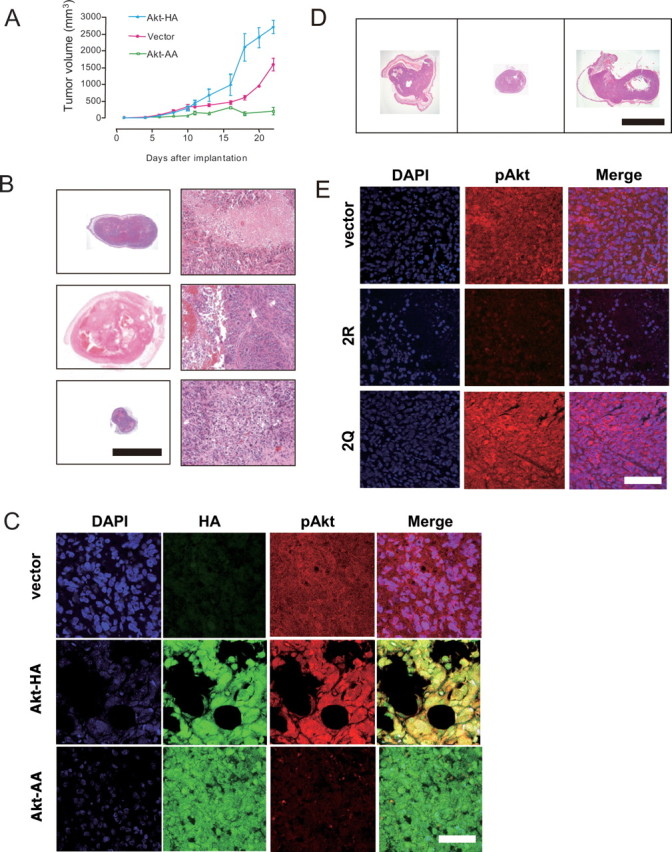
Effects of manipulating Akt activities on tumor growth in vivo. A, Effects of adenoviral transfer of Akt-HA cDNA and Akt-AA cDNA on growth rates of tumors grafted into the subcutaneous tissue of nude mice: injection of AxCALNLmyr-Akt-HA without AxCANCre (vector for control; red line); AxCALNLmyr-Akt-HA with AxCANCre (expression of Akt-HA; blue line); and AxCALNLmyr-Akt-AA with AxCANCre (expression of Akt-AA, green line). For each treatment, 12 animals were used. Each plot represents the mean ± SEM (n = 12) of the tumor volume. B, Histology of tumor tissues treated with only the vector (top row), Akt-HA cDNA (middle row), or Akt-AA cDNA (bottom row). Macroscopic (left column) and microscopic (right column) views of HE staining are shown. Akt-HA-expressing tumors exhibited a high degree of anaplasia with several large, thrombosed tumor vessels. Scale bars: left column, 1 cm; right column, 100 μm. C, Immunostaining with anti-HA-tag antibody (left column, green; FITC) and anti-pAktSer473 antibody (center column, red; Texas red) for tumor tissues treated with only the vector (top row), Akt-HA cDNA (middle row), and Akt-AA cDNA (bottom row). Merged images are also provided (right column). The Akt-HA-expressing tumor (middle row) exhibited bizarre giant cells and showed a high degree of Akt activation. The Akt-AA-expressing tumor (bottom row) exhibited diminished Akt activation. Scale bar, 50 μm. D, Macroscopic images of tumor tissues treated with only the vector (left row), GluR2 cDNA (middle row), or GluR2Q cDNA (right row). HE staining is shown. Scale bar, 1 cm. E, Immunostaining with an anti-pAktSer473 antibody (center column, red; Texas red) for tumor tissues treated with only the vector (top row), GluR2R cDNA (middle row), and GluR2Q cDNA (bottom row), together with nuclear staining with DAPI (left column, blue). Merged images are also provided (right column). Scale bar, 50 μm.
