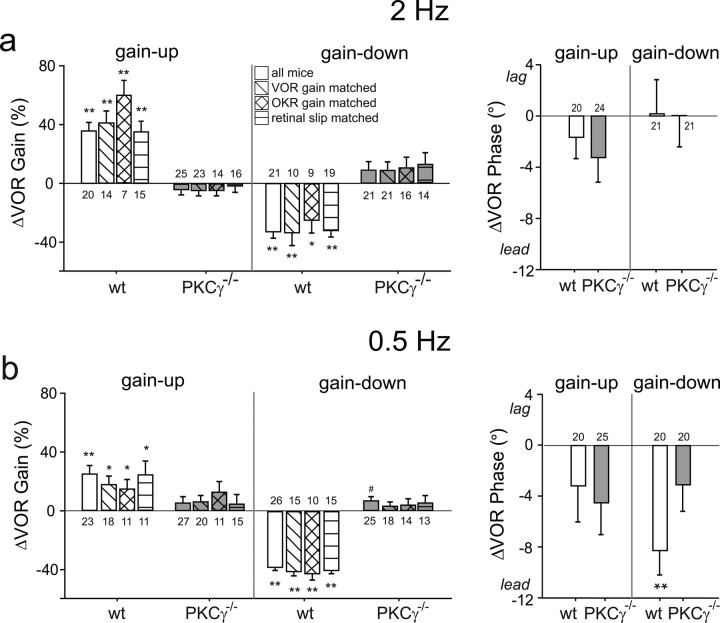
Figure 1.
Impaired VOR motor learning in PKCγ−/− mice. Left, Average percentage change in VOR gain in wild-type (wt; white bars) and PKCγ−/− mice (gray bars) after gain-up (×2) and gain-down (×0) training at 2 Hz (a) and 0.5 Hz (b). Right, Changes in VOR phase induced by each training condition. Open bars indicate data from the full population. Hatched bars are data from subpopulations of wild-type and PKCγ−/− mice matched for baseline VOR gain (diagonal hatched bars), baseline OKR gain (cross-hatched bars), or peak speed of retinal slip during training (horizontal hatched bars). Error bars represent SE. Numbers above or below the bars indicate the number of mice in each population or subpopulation. *p < 0.05, **p < 0.01, one sample t test. #p < 0.05 significant change in VOR gain but in the maladaptive direction.

