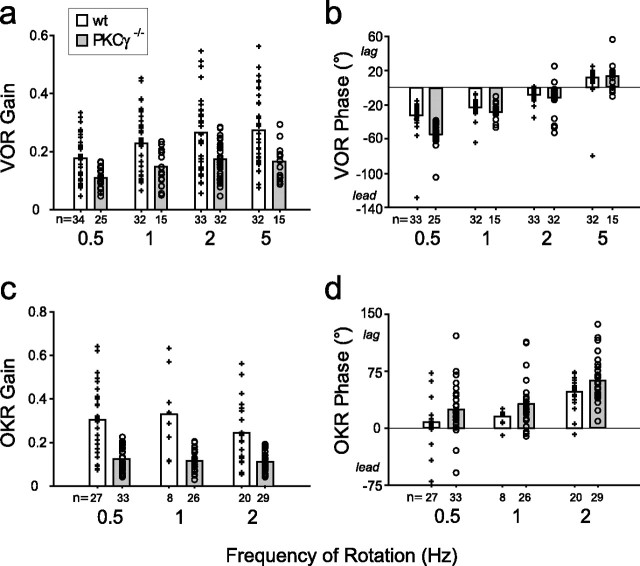
Figure 2.
The baseline VOR and OKR of PKCγ−/− mice are different from those of wild-type mice. Bars represent the average baseline VOR gain (a), VOR phase (b), OKR gain (c), and OKR phase (d) in wt (+, open bars) and PKCγ−/− (○, gray bars) mice measured at different frequencies of head rotation or visual stimulus rotation. Each symbol represents averaged data from one mouse, and the number below each bar indicates the number of mice for each measurement.

