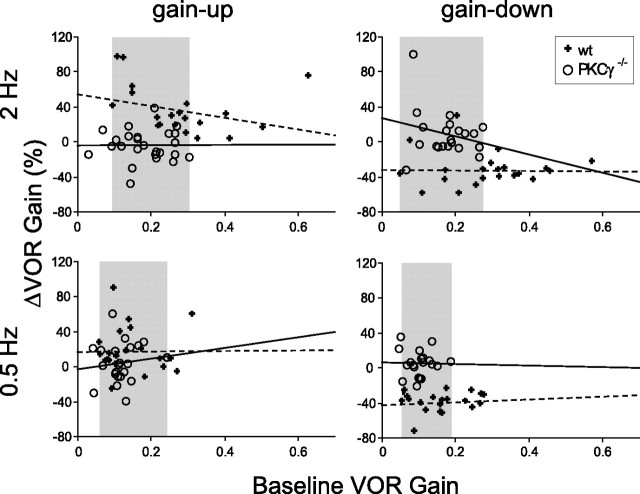
Figure 3.
The learned change in VOR gain as a function of the baseline VOR gain of wild-type (+) and PKCγ−/− (○) mice for each training condition. Each symbol represents data from one mouse. The regression lines for each population of mice are shown: PKCγ−/−, solid lines; wild-type mice, dashed lines. Shaded areas indicate the ranges of baseline VOR gain in the subpopulation of mice used for comparing learning in wild-type and PKCγ−/− mice with similar baseline VOR gains. For number of mice, see Table 1.

