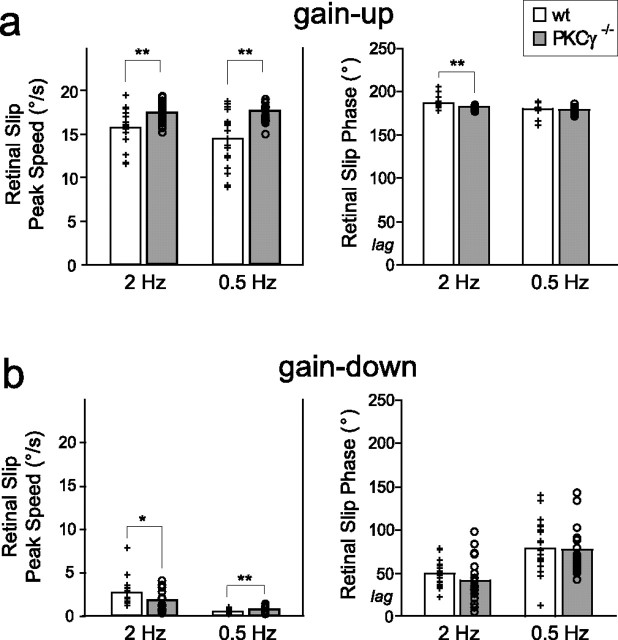
Figure 4.
Retinal slip experienced by wild-type and PKCγ−/− mice during training. Histograms show the average peak speed of retinal slip (left) and average phase of the retinal slip relative to head velocity (right) for wt (+, white bars) and PKCγ−/− (○, gray bars) mice during gain-up (a) and gain-down (b) training at 2 and 0.5 Hz. Each symbol represents data from one mouse. For number of mice, see Table 1. *p < 0.05, **p < 0.01, t test.

