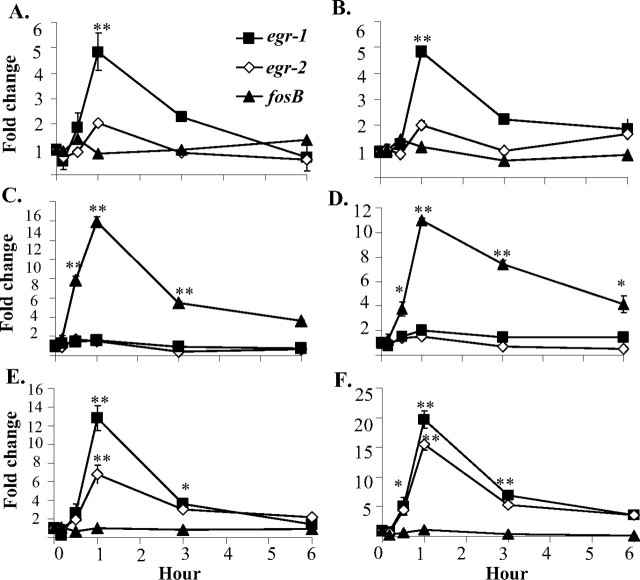
Figure 3.
Kinetic analyses of the regulations of early-response genes by GDNF and NTN in GFRα2 isoform transfectants. The fold change of mRNA expressions of early-response genes in cells expressing GFRα2a (A), GFRα2b (C), and GFRα2c (E) when stimulated with GDNF and GFRα2a (B), GFRα2b (D), and GFRα2c (F) when stimulated with NTN at the designated period of time is shown. The expression levels were measured by quantitative real-time PCR. Similar results were obtained from more than three separate experiments. Error bars indicate SDs of triplicate measurements from one study. Significant differences in expression of genes between ligand stimulated and control were calculated using the paired Student's t test. A value of p < 0.05 was considered significant (**p < 0.001; *p < 0.05).

