
Figure 6.
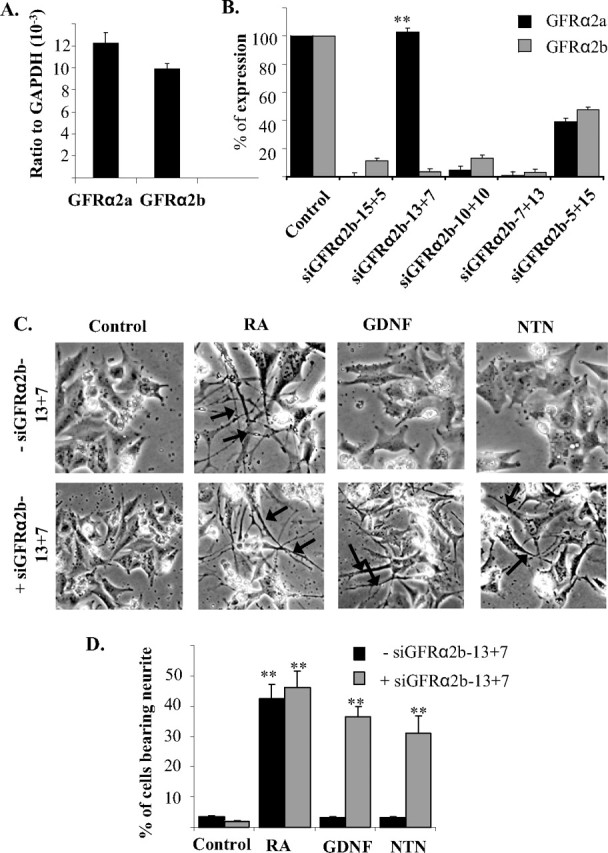
Silencing of GFRα2b expression in human BE(2)-C cells. A, The expression levels of GFRα2a and GFRα2b in BE(2)-C cells were determined using quantitative real-time PCR. B, Effects of various designs of siRNA sequences on the expressions of GFRα2a and GFRα2b in BE(2)-C. siRNA duplex (20 pmol) was transfected into cells, and total RNA was harvested 6 h later. The expressions of GFRα2a and GFRα2b were then measured by quantitative real-time PCR. Significant differences between the expression of the two isoforms after silencing with each of the siRNA designs were calculated using the paired Student's t test (**p = 0.001). C, D, Neurite outgrowth of BE(2)-C cells after silencing of GFRα2b. C, Top row, Cells were stimulated with retinoic acid (5 μm), GDNF, or NTN (50 ng/ml) in the absence of siRNA. Bottom row, Cells were transfected with siGFRα2b-13+7 for 6 h and subsequently stimulated with retinoic acid (5 μm), GDNF, or NTN (50 ng/ml). Pretreament of cells with siGFRα2b-13+7 and subsequent stimulation with GDNF or NTN resulted in the formation of neurite-like structures (arrows). D, Percentages of cells bearing neurites that were at least twice the length of the cells bodies were scored in the presence (+) or absence (−) of the siRNA siGFRα2b-13+7. Similar results were obtained from replicates of three individual experiments. Significant differences in the percentage of cells bearing neurites between ligand stimulated and control were calculated using the paired Student's t test (**p < 0.002; *p = 0.05). Error bars indicate mean ± SD of triplicate measurements. RA, Retinoic acid.