Figure 1.

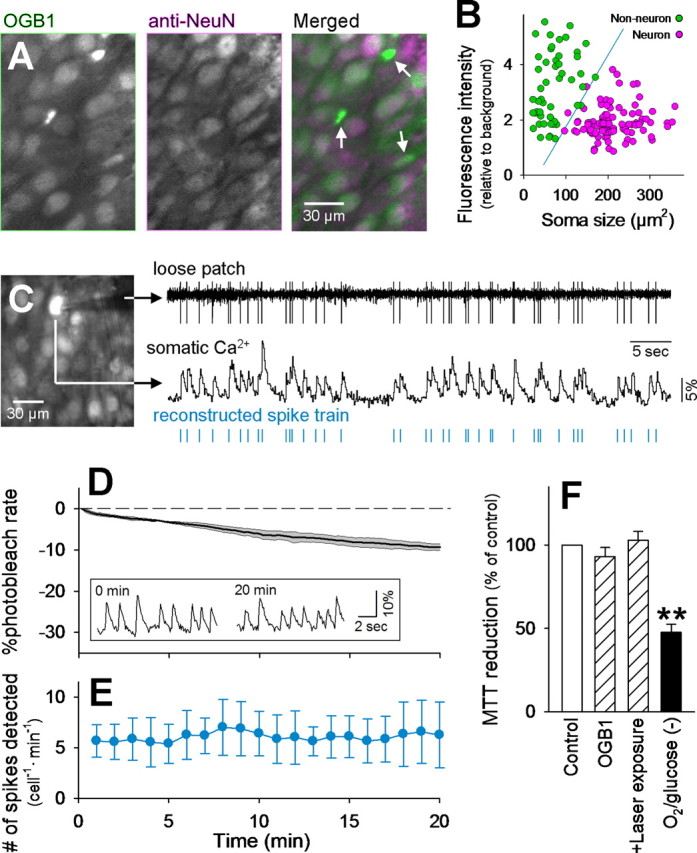
Optical long-time recording of neuronal action potentials with OGB-1. A, An fMCI photograph obtained from the CA3 pyramidal cell layer of a hippocampal slice culture bulk-loaded with OGB-1 (left) and post hoc immunostaining against NeuN (middle) in the same field. Non-neuronal cells are marked by arrows in the merged image (right). B, Distribution of the soma size and baseline fluorescence intensity of OGB-1-loaded cells. Neurons and non-neuronal cells are separable by the blue line that was determined using linear discriminant analysis. The failure rate was <3%. C, Simultaneous loose patch-clamp recording and Ca2+ imaging. The monitored cell is shown by arrows in the confocal image (left). The timing of ∼80% of spikes could be reconstructed from the onsets of individual Ca2+ transients (right). This movie is published in part as supplemental movie 1 (available at www.jneurosci.org as supplemental material). D, Time course of photobleaching. The laser shutter was kept open for 20 min, and the mean fluorescence intensity of the whole imaged field was measured to determine how fast the OGB-1 signal decreased during imaging. The photobleaching rate was ∼0.5%/min, and this rate did not differ among movies. Means and SD are shown as a thick line and shaded area, respectively (n = 6). The inset indicates that the Ca2+ transients of a cell were clearly separable from basal noise immediately (left) and 20 min (right) after the beginning of imaging. E, The number of spikes reconstructed by fMCI was almost invariant during the 20 min period, indicating that detection of spike activity was stable for at least this period. F, MTT reduction of intact (Control) or OGB-1-loaded (OGB-1) slices exposed to laser for 30 min (+Laser exposure). No significant photodamage was observed. As a positive control, some slices were maintained in the absence of oxygen and glucose for 4 h [O2/glucose(−)]. **p < 0.01, Tukey's test after ANOVA. Data are means ± SD of four to six slices.
