Figure 10.

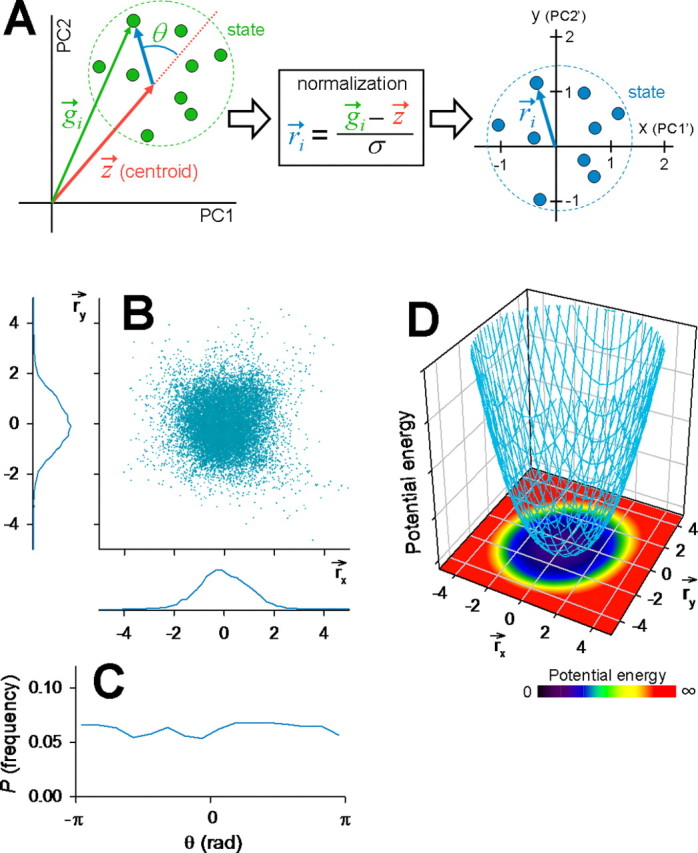
Internal structures and dynamics of network states. A, Schematic illustration for a normalization procedure to quantify network stability. The PC1–PC2 space (left) was transformed to a new plane coordinate (right). r⃗i is a normalized differential vector between an original data point (g⃗i) and the state centroid (z⃗). B, Scatter plots of r⃗i in a new plane (n = 15 slices). The bottom and left histograms show the distributions of r⃗x and r⃗y, respectively. C, Probability density of the angle (θ) between r⃗i and z⃗ in the PC coordinate system. D, Pseudocolored potential energy in the r⃗x versus r⃗y coordinate, which was calculated based on the density of r⃗i obtained from B (see Materials and Methods). The z-axis indicates a three-dimensional representation of this potential energy function (an arbitrary unit).
